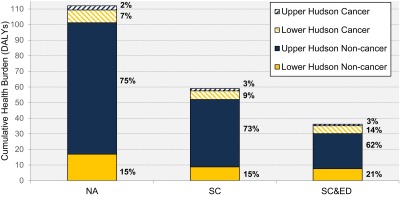
Figure 2.

Comparison of median cumulative induced health burden (DALYs) associated with bioaccumulation of PCBs in Hudson River fish and exposure through fish consumption. Estimates of induced health burden are presented for the three scenarios: a) No Action (), b) Source Control (), and c) the selected remedy combining SC and ED (). Results are stratified by health outcome (cancer vs. noncancer) and river section (Upper Hudson vs. Lower Hudson).
