. 2019 Dec 13;127(12):127004. doi: 10.1289/EHP5034

Figure 3.

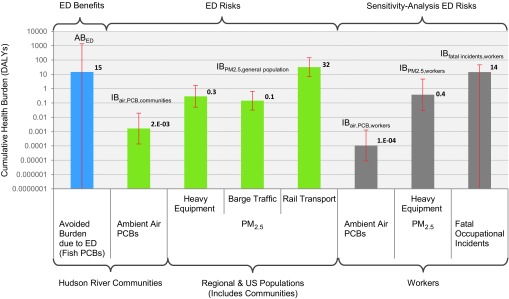
Figure 3 is a bar graph plotting cumulative health burden (DALYs; y-axis) across Hudson River Communities, Regional & US Populations (Including Communities), and Workers. Presented estimates of health burden represent ED risks and a sensitivity analysis of ED risks that includes workers. ED benefits (avoided DALYs) are also included for comparison with ED risks (bottom x-axis and top x-axis).

Comparison of avoided and induced health burdens of environmental dredging (ED) for the Hudson River PCBs Superfund Site. The thinner (red) bars reflect the fifth and 95th percentiles of each Monte Carlo realization. All central estimates are medians, except for fatal occupational incidents, which is based on the arithmetic mean. Worker impacts are included as a separate sensitivity analysis, in case they can be attributed to ED.