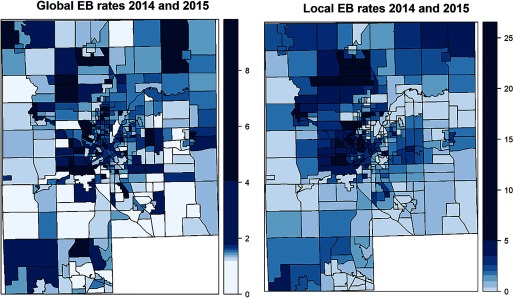
Figure 1.
EB smoothed incidence (Legionnaires’ disease cases per 10,000) in 2014 and 2015 per Genesee County block group. Note: EB incidence rates smooth the intrinsic high variability of rates within block groups that are the result of low numbers of cases per block group. These are weighted averages of individual Census block group and county rates (Global EB, left), or of census block group and neighboring census block group rates (Local EB, right). Weights are proportional to the underlying population in the block groups (U.S. Census Bureau 2015). The incidence color scale is depicted on the right, units are Legionnaires’ disease cases per 10,000 people. EB, empirical Bayes.

