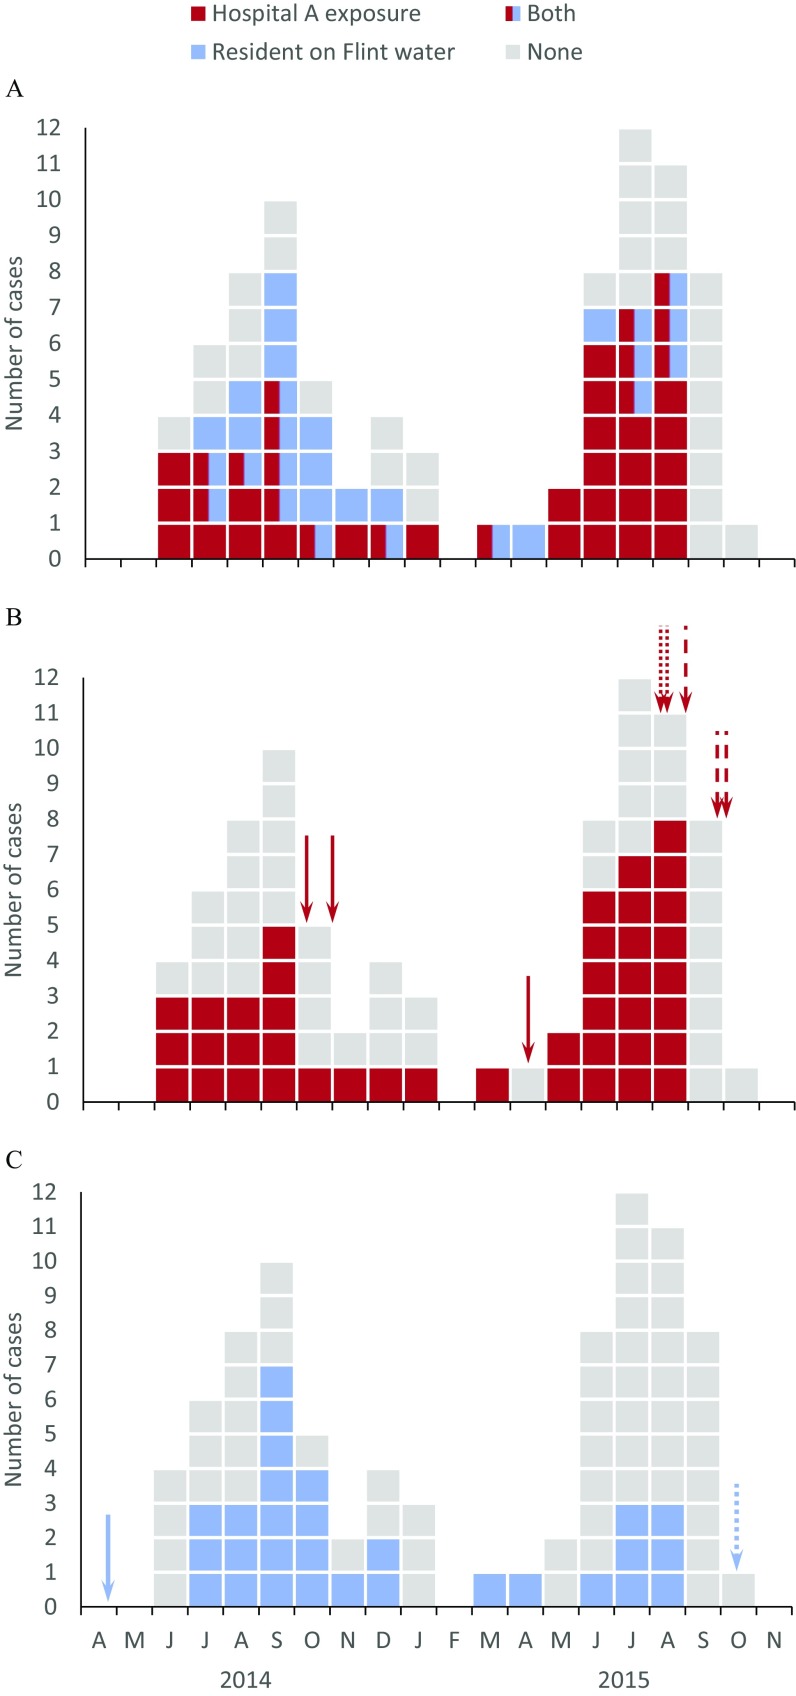
Figure 3.
Epidemic curves of Legionnaires’ disease cases in Genesee County in 2014 and 2015 by month. (A) Cases with exposure to hospital A, residential exposure to Flint water, both exposure to hospital A and residential exposure to Flint water and no exposure to hospital A or residential exposure to Flint water. (B) Cases with and without exposure to hospital A. Arrows represent the date of Legionella control interventions in the plumbing system of hospital A: hyperchlorination events (solid), superheating and hyperchlorination (dotted), and the start of monochloramination (dashed). (C) Cases with and without residence on Flint water. Arrows indicate the date the water source was switched from Detroit water to Flint River (solid) and back (dotted).

