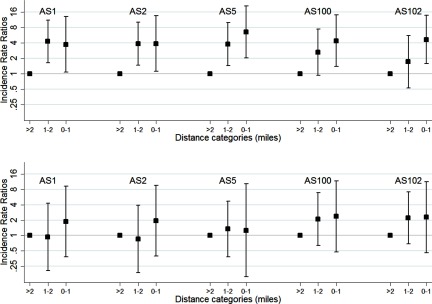
Figure 5.
Incidence Rate Ratio (IRR) of Legionnaires’ disease in Census block groups with a centroid miles, 1–2 miles, and mile from aerosol sources (AS) in (A) 2014 and (B) 2015. Cases with onset between 1 December 2014 and 1 March 2015 were excluded as, generally, cooling towers are not operational in winter. A multilevel Poisson model was nested in Census block groups and adjusted for age group, sex, and interaction factors for age group and sex, and included an interaction factor for cooling tower and year and for residential Flint water exposure and year. Data are available in Table S5A.

