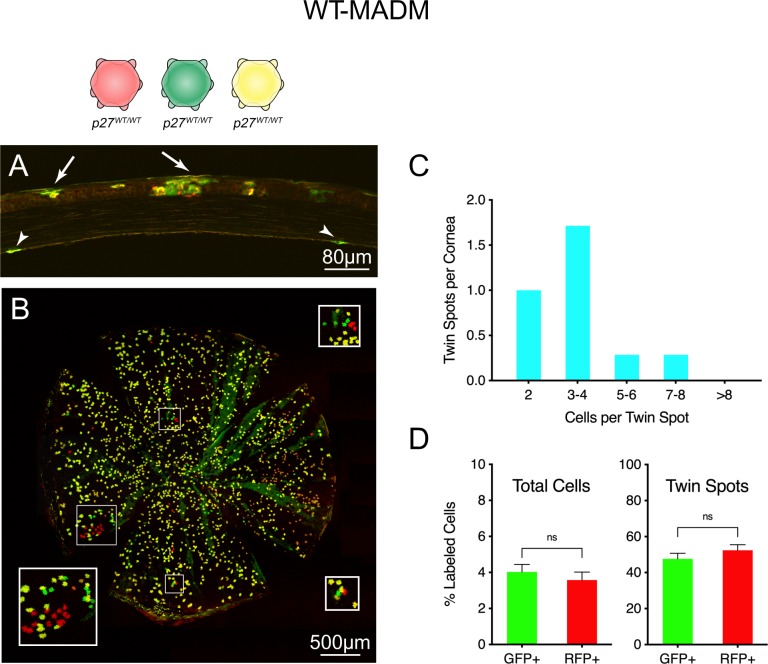
Fig 3. Visualization and analysis of single- and double-labeled cells in WT-MADM corneas.
(A) Tissue section. In this full-thickness cross-section, the anterior corneal surface faces upward. Arrows point to groups of labeled cells within the multilayered epithelium, while arrowheads indicate two stained CEnCs within the endothelial monolayer. (B) Tissue whole-mount. Single- (red and green) and double-labeled (yellow) endothelial cells (all p27+/+) are confined to a thin tissue layer that is generally well-separated optically from fluorescent protein-expressing epithelial and stromal cells. In some places, however, moderate undulation of the flat-mounted tissue leads to bleed through from the epithelial layer (green radial streaks). Boxed areas indicate regions of interest (ROIs) containing groups of single-labeled cells resulting from G2X recombination events. Insets show boxed areas at 2X magnification. (C) Distribution of twin spot sizes (see Materials and Methods for a description of how twin spots were identified). The majority (83%) of twin spots contain two to four cells. (D) Relative proportion of single-labeled GFP+- and RFP+-positive cells in whole corneas and twin spots. Approximately equal percentages of MADM-generated red and green cells are observed, whether the data include the total number of single-labeled cells in corneas and are expressed relative to all labeled cells (red, green and yellow; left) or only the subset of single-labeled cells in individual twin spots (right). Values plotted in (C) result from analysis of 23 twin spots from seven corneas. Data in (D) represent means ± SEM (n = 5). Unpaired t-test was performed. ns indicates not significant.

