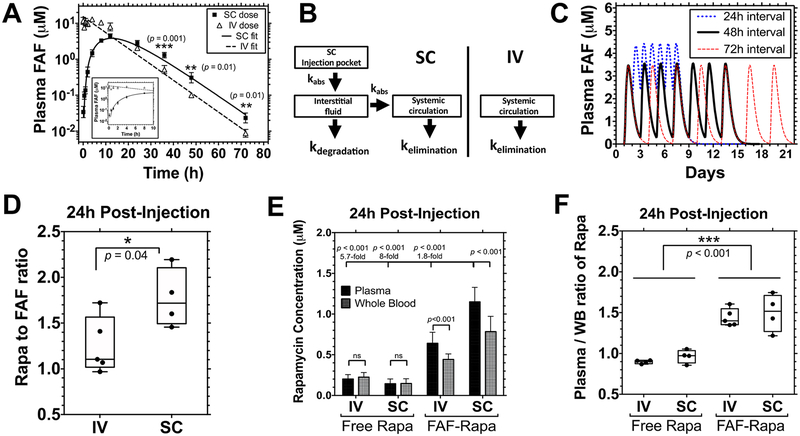
Figure 3.
Pharmacokinetic analysis reveals that SC administration of FAF–Rapa improves pharmacokinetic properties of Rapa. (A–D) 1.0 mg of Rapa/kg of BW of Rho–FAF–Rapa was injected either IV (n = 4) or SC (n = 5) to male NOD mice. (A) Data for the first 10 h are shown in the inset. SC administration yielded significantly higher Rho–FAF concentrations at 36, 48, and 72 h (Mean ± SD). A Student’s t test was used to compare groups. (B) Data were well-fit by either a one-compartment (IV) or three-compartment (SC) pharmacokinetic model as indicated. kabs = kabsorption. (C) On the basis of these parameters, pharmacokinetic modeling was performed to explore several dosing options prior to initiating a therapeutic study. (D–F) Male NOD mice were injected with 1.0 mg of Rapa/kg of BW as free Rapa IV (n = 4), free Rapa SC (n = 4), FAF–Rapa IV (n = 5), or FAF–Rapa SC (n = 4). Plasma and whole blood samples were collected via cardiac puncture after 24 h. (D) For each sample, Rapa concentration analyzed by LC–MS was compared with its fluorescence intensity analyzed by a plate reader to measure the Rapa to FAF ratio (min, mean, and max are depicted). A Student’s t test was used to compare groups, which revealed that at 24 h, SC administration retained nearly the starting ~2:1 ratio of Rapa:FAF, while FAF–Rapa-administered IV had lost about half of the bound drug. (E) Rapa concentration from each sample was analyzed by LC–MS (Mean ± SD). A Student’s t test and one-way ANOVA were used to compare groups. (F) For each sample, Rapa concentration in the plasma was compared to that of the whole blood (WB) (min, mean, and max are depicted). A two-way ANOVA was used to compare groups, which revealed that FAF reduces accumulation of Rapa in blood cells compared to the free drug.

