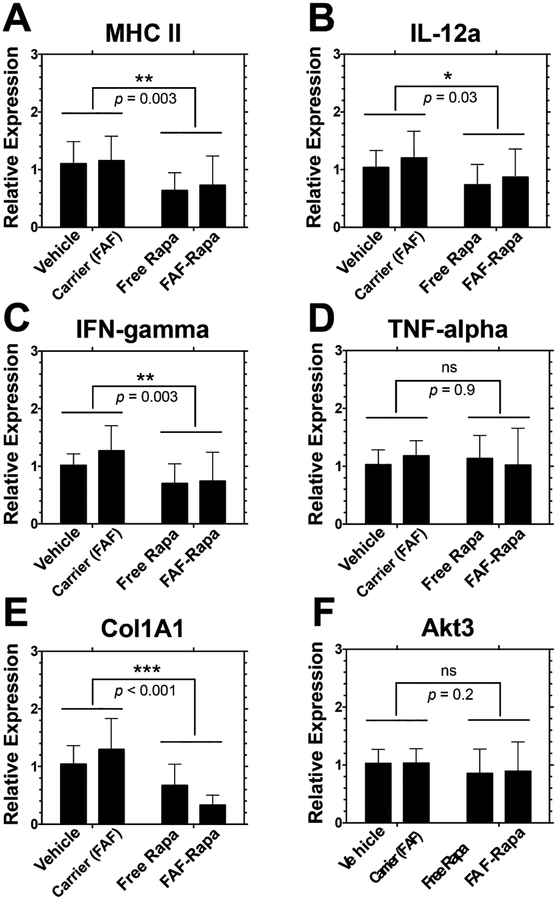
Figure 5.
Gene expression profile of proteins involved in inflammation, antigen presentation, and autophagy in LG of male NOD mice treated with subcutaneous Rapa. One of each pair of LGs from mice in the treatment cohorts was collected at the conclusion of the study for mRNA extraction. Extracted mRNAs were reverse transcribed to cDNA and further analyzed by quantitative real-time PCR. Gene expression levels were normalized to vehicle (mean ± SD, n = 9). Two-way ANOVA was used to compare effects of drug and carrier. On the basis of a significant interaction between Rapa and FAF for Col1A1 (p = 0.025), one-way ANOVA and post hoc comparisons revealed significant differences between vehicle vs FAF–Rapa (p = 0.003); free Rapa vs FAF (p = 0.007); and FAF vs FAF–Rapa (p < 0.001).

