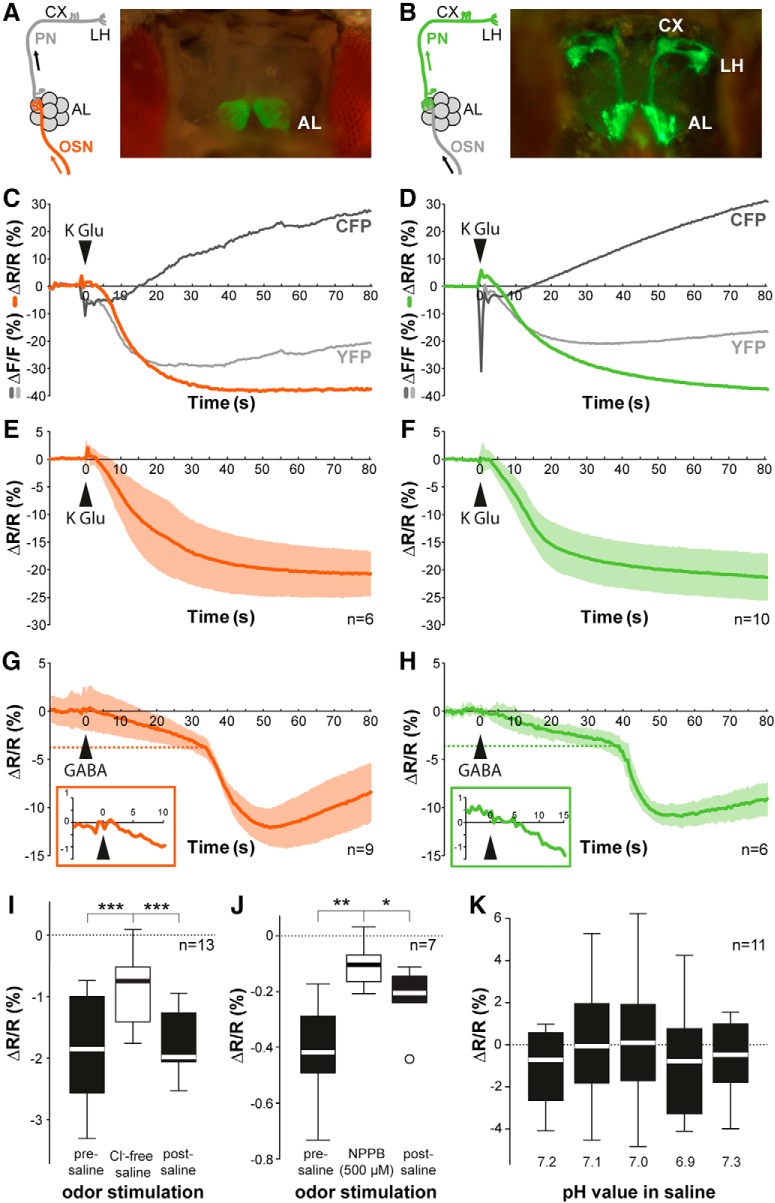
Figure 1.
Clomeleon is a functional chloride indicator in Drosophila olfactory neurons. A, B, Schematic of AL neurons indicating expression site of Clomeleon with images of brain preparation showing Clomeleon YFP baseline fluorescence (A, OSNs; B, PNs). AL, antennal lobe; CX, calyx; LH, lateral horn. C, D, Fluorescence change in a representative animal over time of CFP, YFP, and YFP:CFP ratio induced by KGlu application (1 M, 20 μl) into saline (300 μl) in OSNs (C) and PNs (D). E, F, Time course of [Cl-]i increase induced by applying KGlu (arrowhead) averaged across several animals in OSNs (E) and PNs (F). Color shading indicates SD, n = 6–10. G, H, Time courses of [Cl-]i increase induced by GABA application (1 M, 20 μl) into saline (300 μl) averaged across several animals in OSNs (G) and PNs (H). Insets show enlarged area around the time point of GABA application. Dashed lines mark the biphasic response threshold. Color shading indicates SD, n = 6–9. I, Effect of Cl- free saline application on Cl- changes evoked by ethyl-3-hydroxybutyrate in OSNs. Box plots represent median value (horizontal line inside the box), interquartile range (box), and minimum/maximum value (whiskers). Removing Cl- significantly reduced the Clomeleon signal (***p < 0.001, repeated measures ANOVA, n = 13). J, Effect of chloride channel blocker NPPB (500 μM) application on Cl- signals evoked by ethyl-3-hydroxybutyrate in OSNs (**p < 0.01, *p < 0.05, repeated measures ANOVA, n = 7). K, Quantification of Clomeleon baseline fluorescence in OSNs at different saline pH in relation to standard condition (i.e., pH 7.3). Arrangement of different box plots from left to right reflects temporal sequence of the experiment (p = 0.144, repeated measures ANOVA, n = 11).

