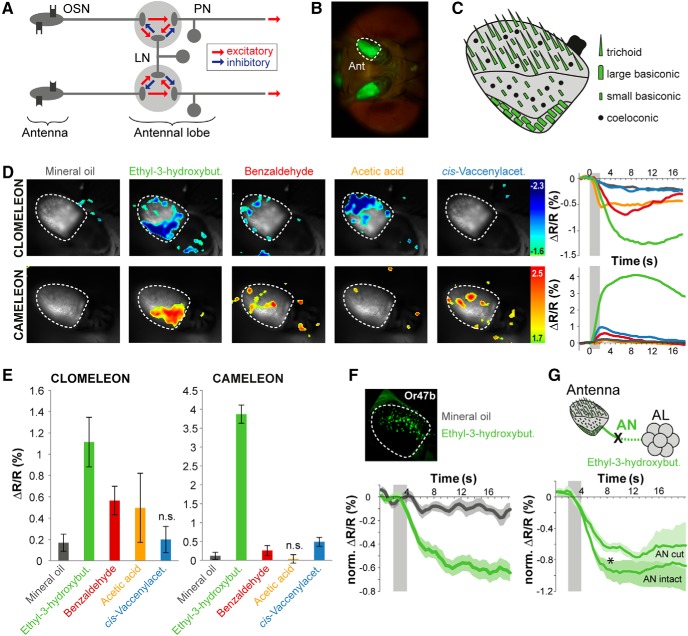
Figure 2.
Odor application induces spatially confined chloride influx in OSNs in the Drosophila antenna. A, Network model scheme of neuronal connectivity in the fly AL. B, Clomeleon YFP baseline fluorescence in OSN dendrites in the Drosophila antenna (Ant). C, Schematic of olfactory sensilla distribution on the third antennal segment. Sensilla marked in green are labeled by Orco-Gal4. D, Pseudocolor rendering of odor-evoked changes in Cl- concentration using Clomeleon (upper row) and in Ca2+ concentration using Cameleon (lower row) in response to different odors and mineral oil in OSN in the antenna. Images represent ΔR/R (%) superimposed onto raw fluorescence images according to the scales and color codes on the right. Time courses on the right reveal representative Cl- and Ca2+ signals for different odors across the entire antennal segment. Odor application is indicated by a gray bar. E, Quantification of Cl- (left) and Ca2+ (right) responses to different odors and mineral oil (n.s., not significant from solvent; repeated measures ANOVA followed by Dunnett multiple comparisons test, n = 8). F, Maximum intensity projection of Clomeleon expressed in the antenna under the control of Or47b-Gal4. Time courses of normalized Cl- responses to the solvent control mineral oil and ethyl-3-hydroxybutyrate (n = 8). G, Schematic of the connection between the antenna and AL via the antennal nerve (AN), which was disrupted here. Time course of normalized Cl- responses to ethyl-3-hydroxybutyrate in three animals of the left antenna (AN intact, solid line) and right antenna after the right AN was cut (AN cut, dotted line). Lines indicate means, color shading gives SEM (*p < 0.05, two-way ANOVA).

