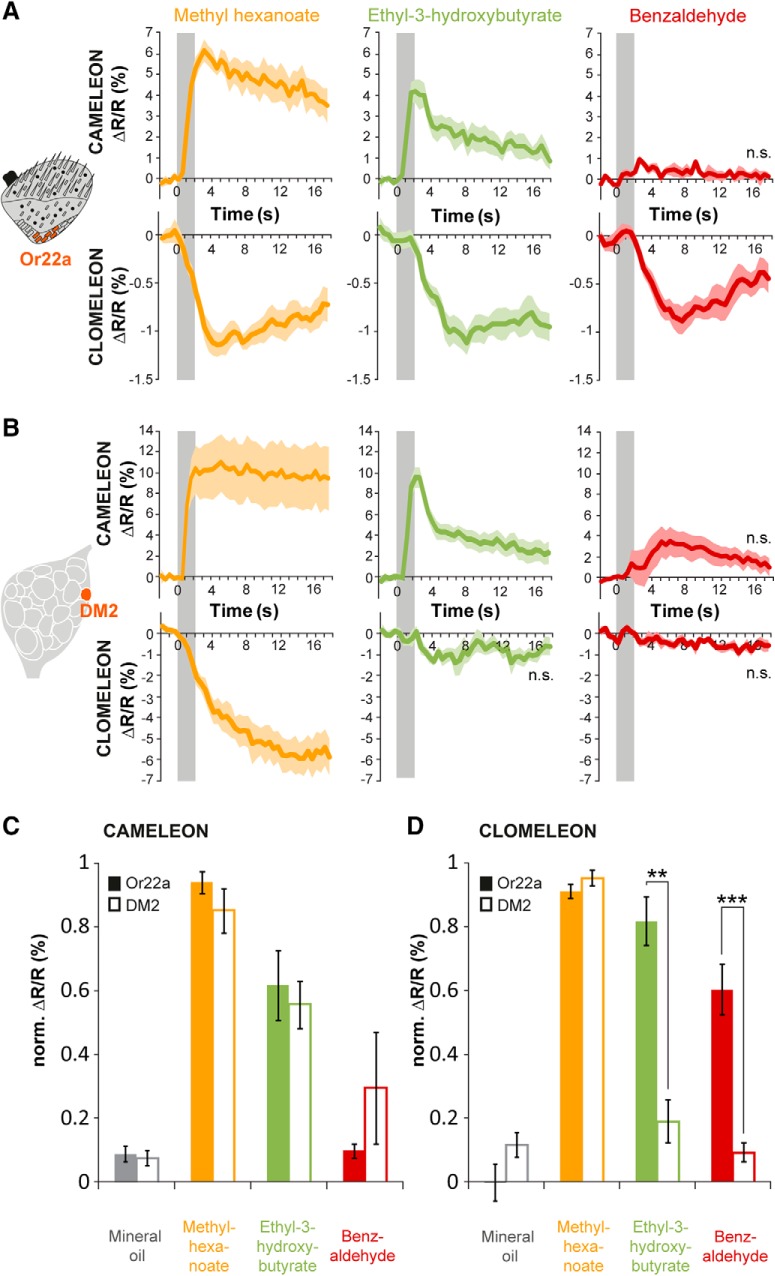
Figure 4.
Chloride responses are modulated on their way from the antenna to the AL. A, left, Schematic of the third antennal segment illustrating selective expression of Cameleon or Clomeleon in dendrites and somata of Or22a-expressing OSNs. Right, Averaged time courses of Ca2+ (upper row) and Cl- influx (lower row) in Or22a-expressing OSNs in the fly antenna to three different odors. Odor stimulation is indicated in gray. Lines represent means, color shadings represent SEM (n.s. not significant from solvent; n = 6–7). B, left, Schematic of the Drosophila AL indicating selective expression of Cameleon or Clomeleon in axonal termini of Or22a-expressing OSNs which converge to glomerulus DM2. Right, Averaged time courses of Ca2+ (upper row) and Cl- influx (lower row) in DM2 to three different odors. Odor stimulation is marked in gray. Lines represent means, color shading represents SEM (n = 6). C, D, Quantification of Ca2+ (C) and Cl- (D) influx in Or22a-expressing OSNs to three different odors and mineral oil. Data are shown as pair-wise comparisons between antenna (Or22a) and AL (DM2). Clomeleon and Cameleon responses have been normalized to highest Cl- or Ca2+ influx in each animal over all odors, respectively. Cl- responses to ethyl-3-hydoxybutyrate and benzaldehyde are significantly lower in the AL compared to the antenna (**p < 0.01, ***p < 0.001, Mann–Whitney test, n = 6–7).

