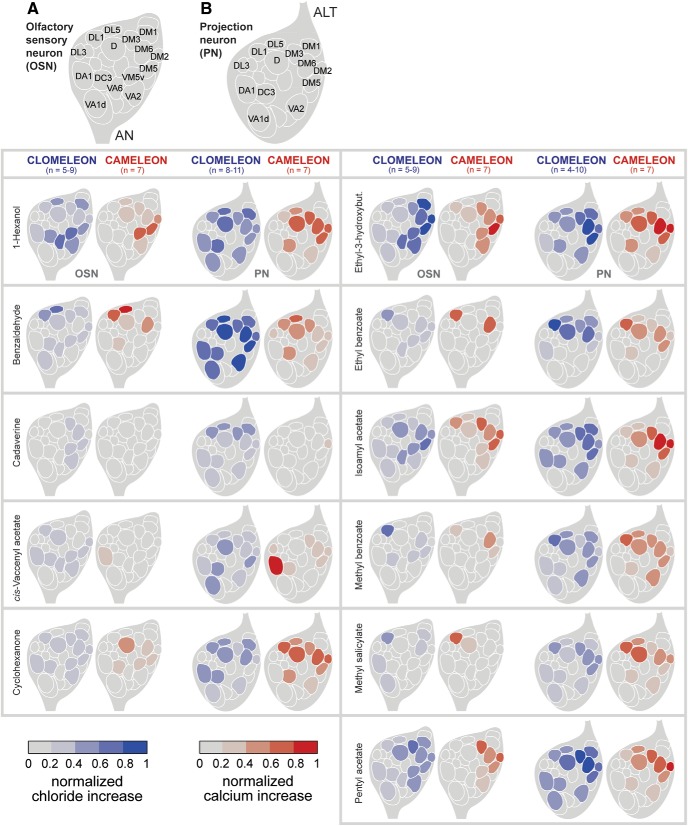
Figure 6.
A functional map of odor-evoked inhibition and excitation. A, B, Averaged odor-evoked Cl- (left, in blue) and Ca2+ (right, in red) responses in OSNs (A) and PNs (B) are represented as schematic ALs for 11 odors according to the scales below. Responses were normalized to highest Cl- or Ca2+ influx in each animal over all odors. Glomerular identities are indicated by AL maps at the top. AC, antennal commissure; AN, antennal nerve; ALT, AL tract.

