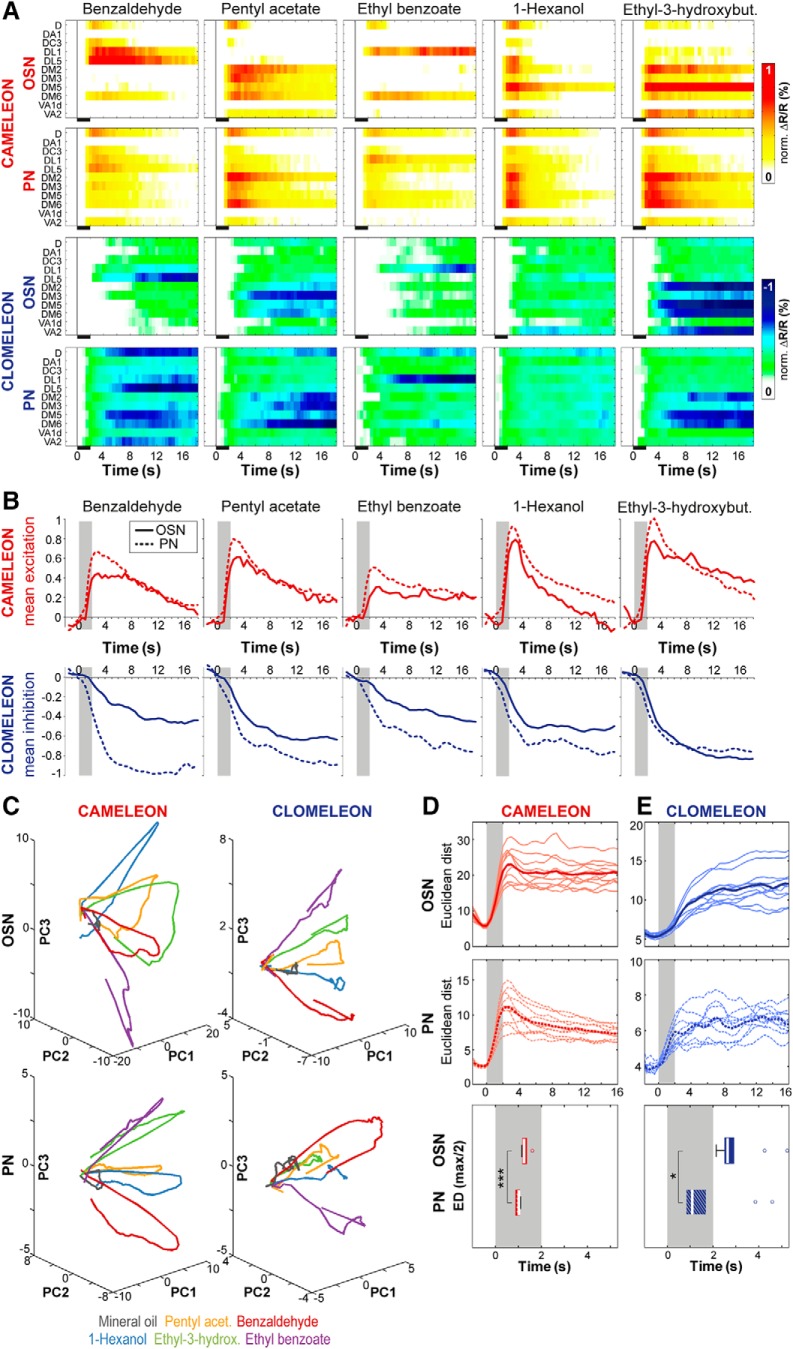
Figure 7.
Input-output transformation of odor-evoked Ca2+ and Cl- responses. A, False colored activity of averaged odor-evoked Ca2+ (white-yellow-red) and Cl- (white-green-blue) influx to different odors for the same set of glomeruli in OSNs (upper panels) and PNs (lower panels) over time. Responses were normalized to highest Cl- or Ca2+ influx in each animal over all odors before averaging. Black bars indicate odor application. B, Time courses of mean excitation (above, red) and inhibition (below, blue) to different odors averaged over all glomeruli and animals for OSNs (solid line) and PNs (dotted line). Odor stimulation is given by a gray bar. Cameleon, n = 7; Clomeleon, n = 9–11. C, Odor separation visualized using principal component analysis. The first three principal components account for 67.3% (OSNs: Cameleon), 67.4% (OSNs: Clomeleon), 79.7% (PNs: Cameleon), and 59% (PNs: Clomeleon) of the variation in the related data set. Plotting the first three principal components reveals odor-specific trajectories of ensemble activity in OSNs (upper panels) and PNs (lower panels). D, upper two panels, Time-resolved Euclidean distances (ED) between population vectors of different odor representations using Cameleon. Odor stimulation is marked in gray. Distances were calculated separately for OSN (solid lines) and PN (dotted lines) responses. Individual pair-wise odor distances are given by thin lines, averaged Euclidean distances are shown in bold. Lower panel, Latency to half maximal odor separation based on normalized Euclidean distances for 10 pair-wise odor combinations (individual lines in B) for Ca2+ signals in OSNs and PNs. PNs reach half maximum odor separation significantly earlier than OSNs (***p < 0.001, two-tailed paired t test; n = 7). E, Same as in D for Clomeleon-derived odor responses. Half maximum odor separation based on odor-evoked Cl- responses occurs significantly earlier in PNs than in OSNs (*p < 0.05, two-tailed paired t test; n = 9–11).

