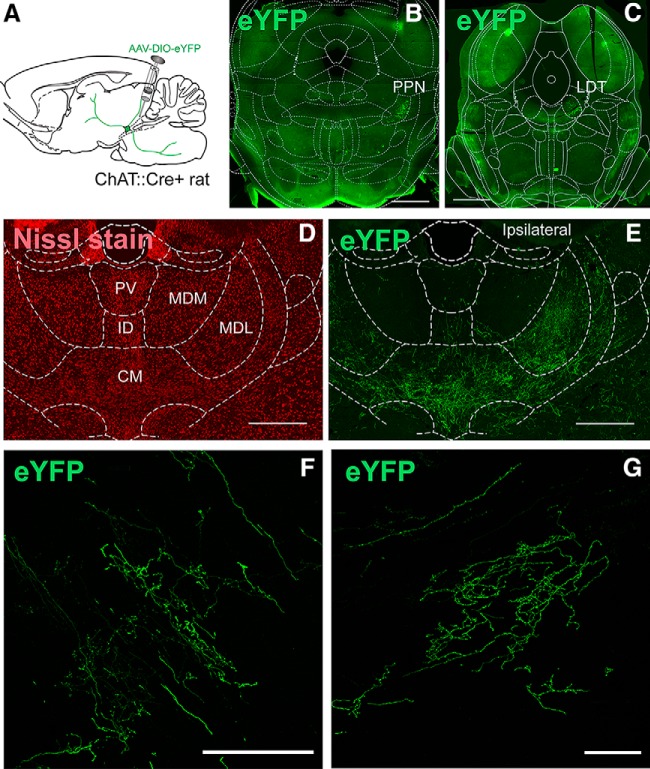
Figure 1.
Analysis of the distribution of midbrain cholinergic axons in the thalamus. A, Experimental strategy: AAV2–EF1a-DIO-eYFP was injected into the caudal portion of the PPN or the LDT. B, C, YFP-labeled neurons were located at the level of the PPN (B) or the LDT (C). D, E, Selected sections were Nissl-stained to delimit the borders of individual thalamic nuclei and were used to determine the distribution of axons (E) on each nucleus. F, G, Representative coronal confocal images showing the pattern of cholinergic axonal thalamic projections arising in the PPN (F) and LDT (G). Scales bars: 1 mm (B, C), 500 μm (D, E), and 100 μm (F, G).

