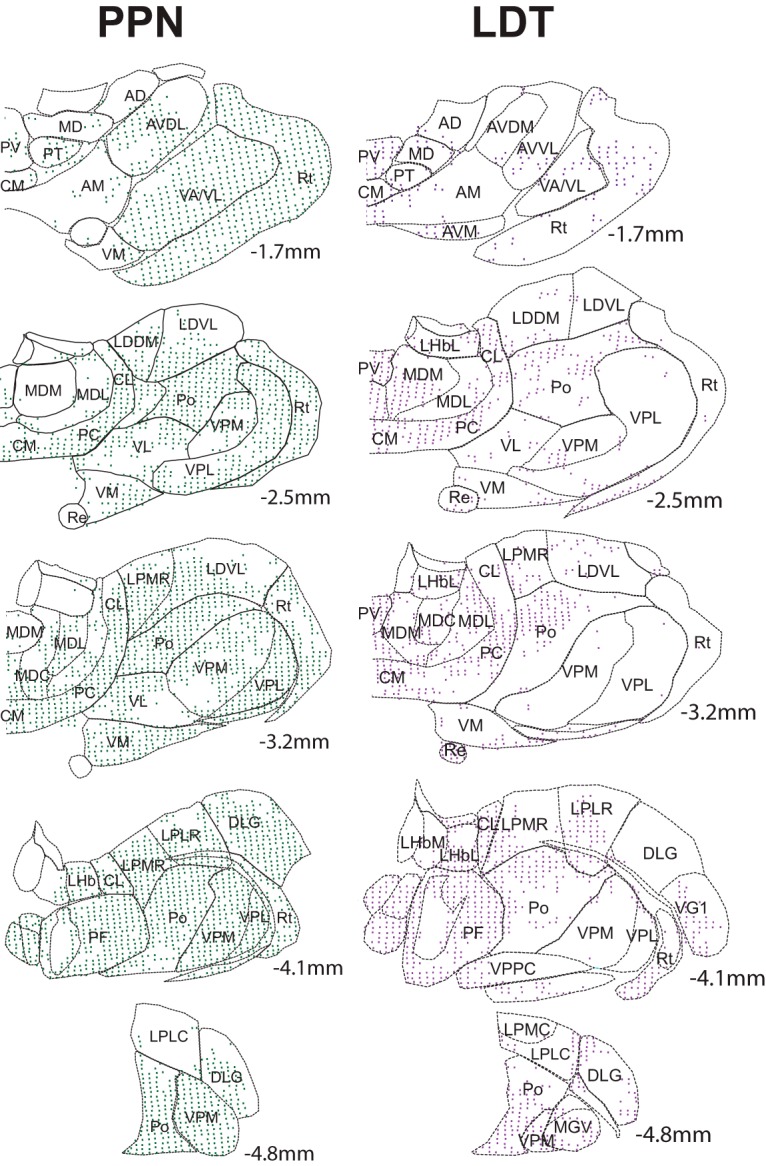
Figure 2.

Mapping of midbrain cholinergic axons in individual thalamic nuclei. The spatial distribution of cholinergic axons arising in the PPN (left) or the LDT (right) on each thalamic nucleus was mapped in five selected, Nissl-stained coronal sections along the rostro-caudal axis. Each colored dot represents a 60 × 80 μm grid that contained YFP-positive axons.
