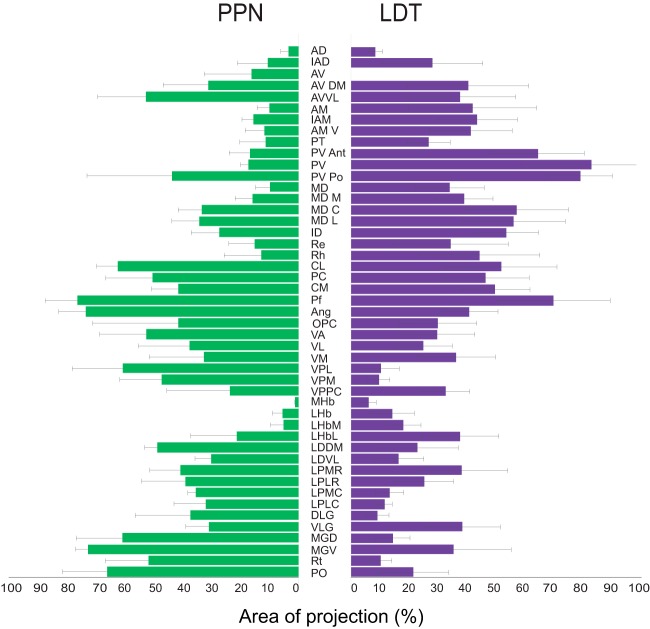
Figure 3.
Axonal distribution of PPN and LDT cholinergic axons in the thalamus. Histogram showing the comparison of the distribution density of PPN (n = 3) and LDT (n = 3) YFP-transduced cholinergic axons. Data are expressed as the percentage of the total area occupied by labeled axons (defined by the counting grid) for each of the thalamic structures (mean ± SEM).

