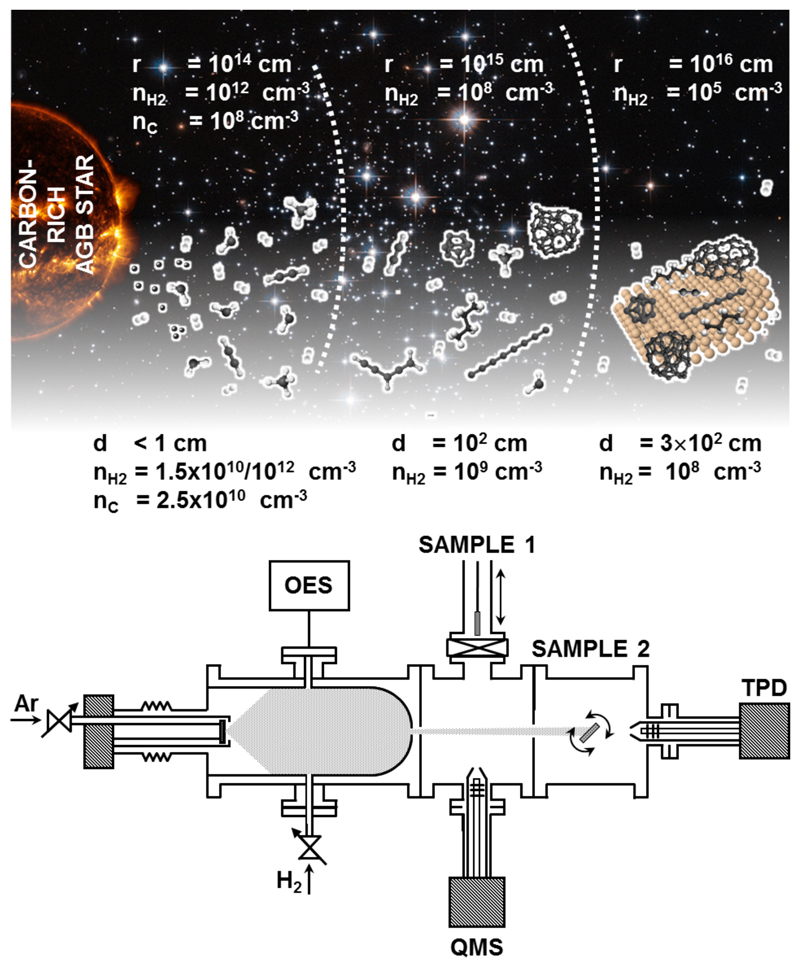
Fig. 1. Production of stardust analogues.
Upper part: pictorial representation of the CSE of a C rich AGB star, with typical carbon and hydrogen densities at given distances provided according to reference28. Lower part: Schematic of the Stardust machine configuration used in these experiments, considering typical C and H2 densities. From left to right: there are three different vacuum environments: aggregation zone, where OES measurements are performed and H2 introduced; expansion area, where the quadrupole mass spectrometer (QMS) is placed and we collect samples for ex situ studies (sample 1 position), and analysis area (sample 2), where thermal programmed desorption (TPD) is performed.

