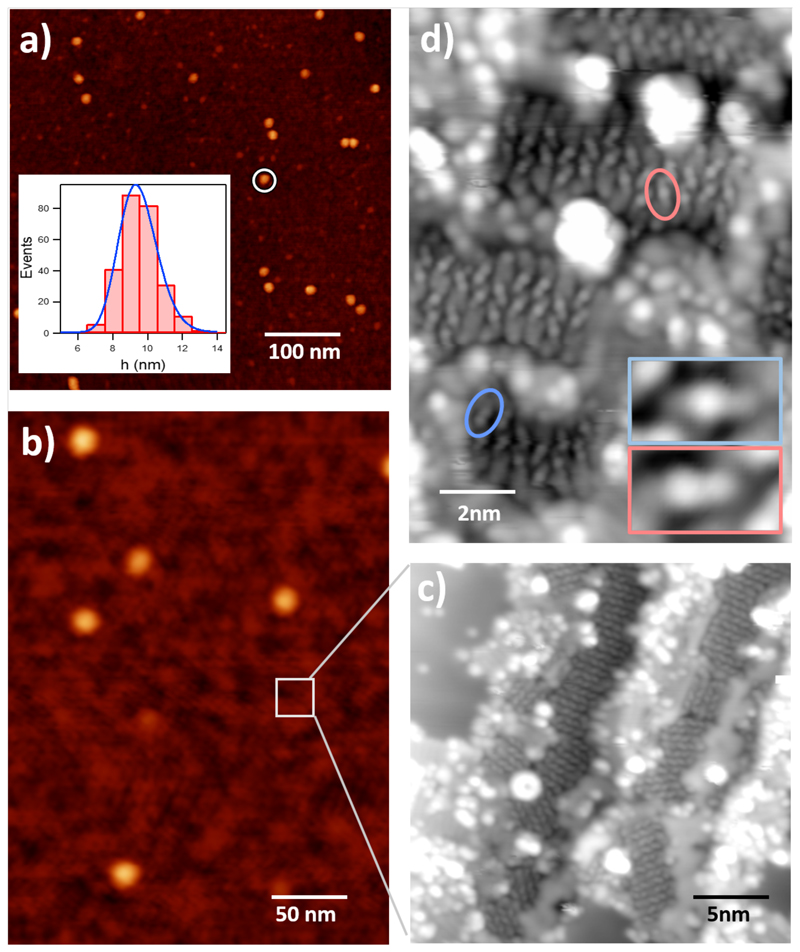
Fig. 2. Production and structure of the stardust analogues.
a-b, AFM images recorded ex situ on a SiOx surface at the position labelled “sample 1” in Fig. 1, showing the presence of C-nanoparticles and small clusters forming an almost continuous layer. A single nanoparticle is encircled in fig. 2a. Inset of fig. 2a shows the size distribution in a bar-histogram performed over several images. The blue line represents the log-normal fitting of the size distribution c-d, in situ recorded STM images of a C-cluster film deposited on a Au surface at “sample 2” position in Fig. 1. Scanned area: 25x25 nm2, recorded at 50 pA, 1400 mV. Inset: Zoom of the rectangular area 5x3 nm2, I= 10 pA, V=1400 mV. Two small molecules are encircled and zoomed in the inset of fig. 2d. The white lines showing the enlarged area in fig. 2b are for clarity and do not correspond to the exact area where measurements were taken. All images were recorded for the case of low- H2 concentration.

