

Abstract
The aim of this study was to determine the effect of 14 days of 5-aminoimidazole-4-carboxamide-1β-4-ribofuranoside (AICAR) treatment on mammalian target of rapamycin (mTOR) signaling and mTOR-regulated processes (i.e., translation initiation) in obese mouse skeletal muscle. Our hypothesis was that daily treatment (14 days) with AICAR would normalize obesity-induced alterations in skeletal muscle mTOR signaling and mTOR-regulated processes to lean levels and positively affect muscle mass. Fourteen-week-old male, lean (L; 31.3 g body wt) wild-type and ob/ob (O; 59.6 g body wt) mice were injected with the AMP-activated kinase (AMPK) activator AICAR (A) at 0.5 mg·g body wt−1·day−1 or saline control (C) for 14 days. At 24 h after the last injection (including a 12-h fast), all mice were killed, and the plantar flexor complex muscle (gastrocnemius, soleus, and plantaris) was excised for analysis. Muscle mass was lower in OC (159 ± 12 mg) than LC, LA, and OA (176 ± 10, 178 ± 9, and 166 ± 16 mg, respectively) mice, independent of a body weight change. A decrease in obese muscle mass corresponded with higher muscle cross section staining intensity for lipid and glycogen, higher blood glucose and insulin levels, and lower nuclear-enriched fractions for peroxisome proliferator-activated receptor-γ coactivator-1α protein expression in OC skeletal muscle, which was normalized with AICAR treatment. AMPK and acetyl-cocarboxylase phosphorylation was reduced in OC mice and augmented by AICAR treatment in OA mice. Conversely, OC mice displayed higher activation of downstream targets (S6 kinase-1 and ribosomal protein S6) of mTOR and lower raptor-associated mTOR than LC mice, which were reciprocally altered after 14 days of AICAR treatment. Dysregulation of translational capacity was improved in OA mice, as assessed by sucrose density gradient fractionation of ribosomes, total and ribosome-associated RNA content, eukaryotic initiation factor 4F complex formation, and eukaryotic initiation factor 4G phosphorylation. These data show that short-term (14 days) AMPK agonist treatment augments regulatory processes in atrophic obese mouse skeletal muscle through the normalization of mTOR signaling and mRNA translation closer to lean levels.
Keywords: AMP-activated kinase, eukaryotic initiation factor 4G, mammalian target of rapamycin, ob/ob
obesity places an individual at greater risk for functional impairment, reduces their activities of daily living, and disrupts metabolic homeostasis (2, 53). Reductions in muscle function stem from a loss of muscle mass (2, 3, 11, 14, 26, 45, 48), which appears to occur largely from an imbalance between the rate of protein synthesis and degradation (14, 48, 54, 55). Protein synthesis and mRNA translation are tightly controlled by anabolic and catabolic hormonal and nutritional cues largely regulated by the mammalian target of rapamycin (mTOR) pathway (1, 6, 61). While acute increases in mTOR promote muscle growth and hypertrophy, chronically high activation of mTOR, as in obese muscle (27, 36, 60), may attenuate muscle growth (56, 57).
mTOR phosphorylates eukaryotic initiation factor (eIF) 4E binding protein-1 (4E-BP1) and ribosomal protein S6 kinase-1 (S6K1) (10). mTOR function is partly regulated through its binding of raptor, the rapamycin-insensitive companion of mTOR (rictor) (5, 28). Raptor and rictor act to target substrates to the transducer of regulated cAMP response element 1 and 2 (TORC1 and TORC2) complexes, respectively. In this regard, raptor binds to a domain present on 4E-BP1 and S6K1 and, thereby, recruits them to the TORC1 complex to be phosphorylated. Under conditions of cell stress, raptor tightly associates with mTOR, thereby reducing activity to the downstream targets 4E-BP1, S6K1, ribosomal protein S6 (rpS6), and eukaryotic elongation factor 2 (eEF2) (28, 62, 64). Unphosphorylated 4E-BP1 binds to eIF4E and prevents binding of eIF4E to eIF4G to form the eIF4F complex (42). During translation initiation, eIF4F binds to mRNA through the association of eIF4E with mRNA, which then binds to the 40S ribosomal subunit complex. This increases the availability and association of eIF4E with eIF4G to form the active eIF4F complex. Binding of the 40S·eIF4F·mRNA complex with a 60S subunit forms an 80S monosome (35).
mTOR and mTOR substrates are inhibited by AMP-activated protein kinase (AMPK) activation (7, 24). AMPK is a well-characterized sensor of cellular energy status and metabolic stress that is regulated by reciprocal changes in the levels of AMP and/or ATP (19), which are observed in response to fasting, aerobic exercise, and muscle contraction. AMPK activators, such as 5-aminoimidazole-4-carboxamide-1β-4-ribofuranoside (AICAR, which is metabolized to ZMP, an AMP mimic), metformin, and other thioglitazones, or other catabolic conditions lead to activation and phosphorylation of AMPK on the T172 residue and its substrate acetyl-cocarboxylase (ACC) (20). Previous studies (7, 16, 62, 64) established an association between an AICAR- and an exercise-induced reduction in translation initiation via a repression of mTOR signaling, presumably through AMPK activation. AMPK activation has also been associated with enhanced expression of skeletal muscle oxidative-related enzymes and proteins (19), which is consistent with the findings that obese skeletal muscles are less oxidative (33) and have less peroxisome proliferator-activated receptor (PPAR)-γ coactivator-1α (PGC-1α) protein expression (4).
It remains unclear how obese skeletal muscle exhibits reduced mass while in a state of nutrient excess and elevated mTOR signaling. Treatment of obese rodent models with rapamycin showed limited success in improving insulin sensitivity, despite reductions in adiposity, which may be due to rapamycin's lipotoxic effects with longer-term use (12, 36, 43, 52). Fewer studies have reported the potential therapeutic benefits of AMPK agonist treatment on mTOR signaling in obese skeletal muscle (44). Therefore, the aim of the present study was to determine the effect of short-term treatment (14 days) with an AMPK agonist on mTOR signaling and mTOR-regulated processes (i.e., translation initiation) in obese mouse skeletal muscle. Our hypothesis was that daily treatment (14 days) with the AMPK agonist AICAR would normalize obesity-induced alterations in skeletal muscle mTOR signaling and mTOR-regulated processes to lean levels and positively affect muscle mass.
EXPERIMENTAL PROCEDURES
Materials.
AICAR was purchased from Toronto Research Chemicals (North York, ON, Canada). Assays for glucose and insulin were purchased from ALPCO (Salem, NH) and Sigma (St. Louis, MO), respectively. Nitrocellulose membrane was purchased from Pall Life Sciences (Port Washington, NY). Tuberous sclerosis (TSC)-2 antibody was purchased from Santa Cruz Biotechnology (Santa Cruz, CA). All other antibodies were obtained from Cell Signaling Technology (Danvers, MA). Enhanced chemiluminescence (ECL) detection kits were purchased from Pierce (Thermo Fisher Scientific, Rockford, IL), and anti-rabbit and anti-mouse horseradish peroxidase-conjugated IgG were purchased from Cell Signaling Technology. BioMag beads were purchased from Invitrogen (Carlsbad, CA).
Animal care.
All experimental procedures were approved by the Institutional Animal Care and Use Committee of the West Virginia University School of Medicine. Fourteen-week-old lean (Lepob/+ or Lepob/?+) and ob/ob (Lepob/Lepob) male mice (catalog no. 000632, Jackson Laboratories, Bar Harbor, ME) were housed in an environmentally controlled room with a 12:12-h light-dark cycle and fed standard chow (catalog no. 2018, Harlan Laboratories). After the 14-day experimental treatment (24 h after AICAR injection, including a 12-h fast), the plantar flexor complex muscle was cleanly (tendon-to-tendon) excised from an anesthetized mouse breathing 4% isoflurane. The muscle was quickly weighed and then processed for histology or frozen in liquid nitrogen and stored at −80°C. The anesthetized mice were killed by transection of the diaphragm and removal of the entire heart, after blood collection via needle puncture directly into the heart, while breathing 4% isoflurane.
AICAR injection.
AICAR or saline (control) was injected subcutaneously into the lateral distal portion of the back. AICAR was administered at 0.5 mg·g body wt−1·day−1 one time per day for 14 days. Saline (control) was injected in volumes identical to those used for AICAR treatment in a manner identical to that of AICAR treatment. Body weight was measured prior to death.
Muscle fiber area and metabolism.
Images of hematoxylin-eosin-stained, 10-μm-thick cross sections from the medial and lateral gastrocnemius muscle were visualized at ×20 magnification using an inverted light microscope (Nikon) and captured with an integrated camera using Nikon Domain software. Fiber areas were measured from control and AICAR-treated lean and ob/ob mice. At least 100 fiber areas were measured per cross section from each sample using ImageJ software (http://rsbweb.nih.gov/ij/).
Blood metabolites.
Kits from ALPCO and Sigma were used according to the manufacturer's instructions for collection and analysis of blood serum for insulin and glucose, respectively.
Nuclear-enriched fraction.
As described in previous work from our laboratory (63, 65), the muscle samples were homogenized in 10 volumes of CHAPS-containing buffer [40 mM HEPES (pH 7.5), 120 mM NaCl, 1 mM EDTA, 10 mM pyrophosphate, 10 mM β-glycerophosphate, 40 mM NaF, 1.5 mM sodium vanadate, 0.3% CHAPS, 0.1 mM PMSF, 1 mM benzamidine, and 1 mM DTT]. The resulting homogenate was clarified by centrifugation at 1,000 g for 3 min at 4°C. The supernatant contained the cytoplasmic fraction. The pellet was washed with CHAPS buffer three times, centrifuged at 1,000 g for 3 min at 4°C, and then resuspended in 50 μl of lysis buffer, and 8.3 μl of 5 M NaCl were added to lyse the nuclei. This mixture was rotated at 4°C for 1 h and then centrifuged at 12,578 g for 15 min at 4°C. The supernatant contained the soluble nuclear fraction. An equal volume of 2× SDS-polyacrylamide gel loading buffer was added to each fraction for Western analysis.
Evaluation of phosphorylated and total proteins.
The muscle was homogenized in CHAPS-containing buffer (see Nuclear-enriched fraction) and then clarified by centrifugation at 1,000 g for 3 min at 4°C. Equal protein from the lysates was then combined with an equal volume of 1× SDS sample buffer, boiled, and resolved by electrophoresis on a SDS-polyacrylamide gel. The proteins were transferred to nitrocellulose membranes, which were incubated with antibodies directed against T172 for AMPK, S79 for ACC, T389 for S6K1, S240/S244 for rpS6, T37/46 for 4E-BP1, and T56 for eEF2 and for total protein expression of PGC-1α, AMPK, S6K1, rpS6, 4E-BP1, mTOR, and raptor (1:1,000 dilution). Protein immunoblots were visualized via ECL of horseradish peroxidase-conjugated secondary antibodies (1:5,000 dilution). The blots were quantified by measurement of the luminescent signal using ImageJ software. The phosphopeptide-probed blots were then stripped and reprobed with antibodies that recognize the total form of the protein independent of phosphorylation state and/or GAPDH. Results obtained using phosphospecific antibodies were corrected for total forms of the protein examined or GAPDH and presented as a percentage of the lean control condition. At least two samples from each group were run on each gel for analysis.
Analysis of raptor-mTOR and TSC1-TSC2 association.
Similar to our previous work (64), muscle was homogenized in CHAPS-containing buffer (see Nuclear-enriched fraction), and the homogenate was mixed on a platform rocker for 20 min at 4°C and then clarified by centrifugation at 1,000 g for 3 min at 4°C. An aliquot of supernatant containing 500 μg of protein was combined with 1.4 μl of anti-mTOR or 5 μl of anti-TSC2 antibody and mixed on a platform rocker overnight at 4°C. Immune complexes were isolated with a goat anti-rabbit BioMag IgG (PerSeptive Diagnostics) bead slurry. Prior to use, the beads were blocked with 0.1% nonfat dry milk in CHAPS buffer and then washed in CHAPS buffer. After 1 h of incubation at 4°C, the beads were collected using a magnetic stand and washed twice in CHAPS buffer and once in CHAPS buffer containing 200 mM NaCl, instead of 120 mM NaCl, and 60 mM HEPES, instead of 40 mM HEPES. The immunoprecipitates were solubilized in 1× SDS sample buffer and then boiled for 5 min. The beads were removed by centrifugation, and the supernatant was collected and subjected to SDS-PAGE. The proteins in the gel were transferred to nitrocellulose membranes, which were incubated in anti-raptor or anti-mTOR and anti-TSC1, anti-phospho-TSC2 T1462, or anti-TSC2 antibody (1:1,000 dilution) overnight at 4°C. The blots were visualized by ECL, and then the ratios of raptor and TSC1 to total mTOR and TSC2, respectively, were calculated and expressed as percentage of lean control value. At least two samples from each group were run on each gel for analysis.
Immunoprecipitation of eIF4E complexes.
The association of 4E-BP1 or eIF4G with eIF4E was determined by use of the above-described methodology (mTOR immunoprecipitation) and previously published methods (62). Briefly, eIF4E was immunoprecipitated from the supernatant fraction using a monoclonal anti-eIF4E antibody. Proteins in the immune complexes were resolved by SDS-PAGE and subjected to Western blot analysis for 4E-BP1, eIF4G, anti-phosphorylated eIF4G S1108, or eIF4E. The ratios of eIF4G to eIF4E and 4E-BP1 to eIF4E were calculated and expressed as percentage of lean control value. At least two samples from each group were run on each gel for analysis.
Analysis of polysome aggregation.
Polysome aggregation was determined by previously published methods (64). Sucrose density gradient centrifugation was employed to analyze muscle polysome aggregation state following treadmill exercise. Plantar flexor complex samples were homogenized (model PT10-35, Polytron) for 20 s in 10 volumes of resuspension buffer containing 50 mM HEPES (pH 7.4), 75 mM KCl, 5 mM MgCl2, 250 mM sucrose, 1% Triton X-100, 1.3% deoxycholate, 100 μg/ml cycloheximide, and 25 μl of the RNase inhibitor SUPERasin (per 5 ml). Homogenates were incubated on ice for 5 min, 150 μl/ml Tween-deoxycholate mix (1.34 ml Tween 20, 0.66 g deoxycholate, and 18 ml sterile water) was added, and the samples were thoroughly mixed. Samples were incubated on ice for 15 min and then centrifuged at 1,000 g for 15 min at 4°C. The resulting supernatant (600 μl) was layered on a 20%-47% linear sucrose density gradient [50 mM HEPES (pH 7.4), 75 mM KCl, and 5 mM MgCl2] and centrifuged in a SW41 rotor at 40,000 rpm for 4 h at 4°C. After centrifugation, the gradient was displaced upward (2 ml/min) using Fluorinert (Isco, Lincoln, NE) through a spectrophotometer, and the optical density at 254 nm was continuously recorded (150 cm/h chart speed). The various gradient areas [subpolysomal (consisting of the 40S, 60S, and 80S peaks) and polysomal] from the sucrose gradient fractionation were scanned and quantified using ImageJ public domain software.
RNA isolation.
RNA isolation methodology is described elsewhere (29). Briefly, a total RNA sample (aliquot acquired prior to gradient fractionation) and the polysome-containing portion of the gradient were collected into an equal volume of TRIzol Reagent (Invitrogen). Recovery of the RNA from the dense sucrose portions of the gradient was achieved by 2× dilution of the polysomal fraction with RNase-free water (Ambion), and the appropriate amount of TRIzol was employed. The RNA was extracted using the standard manufacturer's protocol and resuspended in RNA Storage Solution (Ambion). A microfluidics platform (model 2100 Bioanalyzer, Agilent Biotechnologies, Palo Alto, CA) was used to analyze RNA samples for quality and concentration.
Statistics.
Results are means ± SE for eight mice per treatment group, except where stated. Comparisons were made for each variable as follows: 1) a one-way ANOVA with a Student-Newman-Keuls post hoc test to establish significant differences between groups, only after the F statistic indicated an overall significance in the data, or 2) a t-test (lean vs. obese controls) via Prism (version 3.0, GraphPad Software, La Jolla, CA). Significance level was set a priori at P < 0.05.
RESULTS
AMPK and ACC phosphorylation.
mTOR signaling can be inhibited by activation of AMPK (8, 62). Therefore, to test whether inhibition of mTOR signaling would reduce the detrimental effects of obesity on skeletal muscle, we subcutaneously injected obese and lean mice with the well-established AMPK agonist-mTOR antagonist AICAR for 14 days. At 24 h after the last injection (including a 12-h fast), activation of AMPK and its substrate ACC on the phosphorylation sites T172 and S79, respectively, was determined by Western blot analysis to verify the efficacy of the treatment with the AMPK agonist AICAR. Under fasted conditions, AMPK activation should be elevated in a healthy, lean mouse (19). Similar to the findings of previous reports, fasted levels of AMPK T172 and ACC S79 phosphorylation were significantly lower in obese control (OC) mice than in all other groups (Fig. 1) and was at lean [lean control (LC) and lean AICAR-treated (LA)] levels in the obese mice treated with AICAR (OA; Fig. 1).
Fig. 1.

Short-term (14 days) treatment with 5-aminoimidazole-4-carboxamide-1β-4-ribofuranoside (AICAR) normalizes fasted AMP-activated kinase (AMPK) signaling in ob/ob plantar flexor complex muscle. After 14 days of treatment with AICAR (0.5 mg·g body wt−1·day−1) in saline or saline injections and a 12-h fast, equal protein from lean and ob/ob male mouse plantar flexor complex muscle homogenates was subjected to Western blot analysis for AMPK T172 and acetyl-cocarboxylase (ACC) S79 phosphorylation sites, and data were normalized to GAPDH [expressed as percentage of lean control (LC)]. LA, lean AICAR; OC, ob/ob control; OA, ob/ob AICAR. Representative Western blots are shown. Values are means ± SE (n = 8 per group). Means with different letters (a and b) are statistically different from one another for the respective variable (P < 0.05).
Plantar flexor complex muscle characteristics.
The plantar flexor complex (including soleus, plantaris, and medial and lateral heads of gastrocnemius muscles) skeletal muscle weight was lower in OC mice than in all other groups (Table 1). However, after 14 days of AICAR treatment, muscle weight in the OA mice increased compared with the OC mice not receiving AICAR (Table 1) but was still less than in LC and LA mice. Similarly, the mean fiber area of the gastrocnemius medial and lateral heads within the plantar flexor complex (independent of fiber type) was lower in OC mice than all other groups (Table 1). Muscle fiber area significantly increased after 14 days of AICAR treatment in OA mice compared with OC mice (Table 1) and was still less than in LC and LA mice. The alterations in muscle weight and fiber area were independent of a change in body weight over the 14-day experiment for the respective groups (Table 1).
Table 1.
Lean and ob/ob mouse characteristics
| LC | LA | OC | OA | |
|---|---|---|---|---|
| Body wt, g | 31.4 ± 0.4a | 30.9 ± 0.7a | 60.6 ± 0.8b | 60.8 ± 0.6b |
| Plantar flexor complex wt, mg | 175.6 ± 10.1a | 177.7 ± 8.9a | 158.6 ± 12.4b | 166.0 ± 16.2c |
| Fiber area, μm2 | 2,713 ± 267a | 2,482 ± 143a | 1,461 ± 607b | 2,210 ± 203c |
| Insulin, ng/ml | 10.0 ± 2.5a | 8.1 ± 2.1a | 18.0 ± 3.0b | 13.2 ± 2.7c |
| Glucose, mg/dl | 108 ± 12a | 101 ± 10a | 165 ± 13b | 142 ± 11c |
Values are means ± SE (n = 8 per group).
LC, lean control; LA, 5-aminoimidazole-4-carboxamide-1β-4-ribofuranoside (AICAR)-treated lean; OC, ob/ob control; OA, AICAR-treated ob/ob.
Means with different letters (a, b, and c) are statistically different from one another for the respective variable (P < 0.05).
When we examined indicators of overall metabolism, fasted blood insulin and glucose concentrations were higher in OC mice than all other groups. Insulin and glucose levels were decreased in OA mice compared with OC mice (Table 1), but not quite to levels in LC and LA mice. Western blot analysis showed that nuclear PGC-1α protein expression, a strong positive indicator of oxidative metabolism, was lowest in OC mice and highest in both AICAR-treated groups (LA and OA; Fig. 2A, see Table S1 in Supplemental Material). Histochemical analysis for neutral lipids (Oil Red O) and glycogen (periodic acid-Schiff) revealed higher staining intensities in OC mice than all other groups, and AICAR treatment reduced the staining intensities for Oil Red O and periodic acid-Schiff in OA mice only (similar to LC and LA mice; Fig. 2B).
Fig. 2.
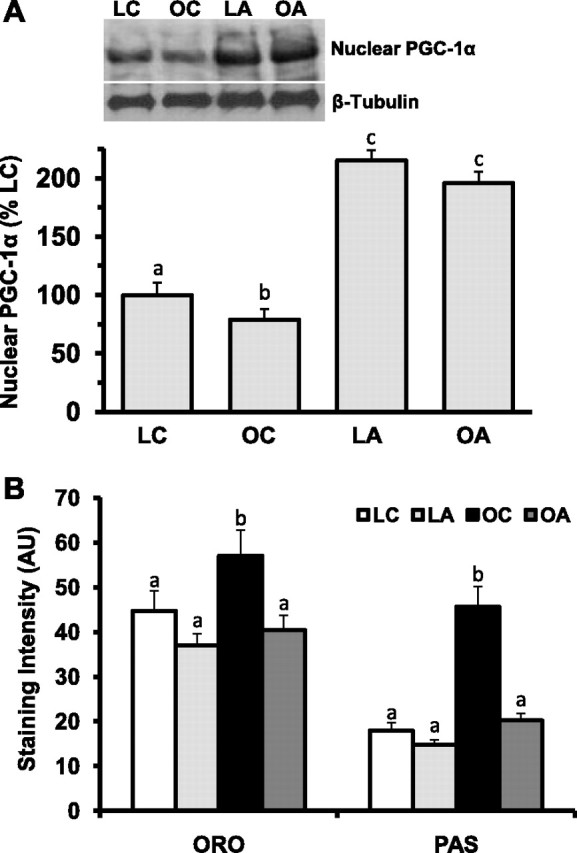
Short-term treatment (14 days) with AICAR normalizes nuclear peroxisome proliferator-activated receptor-γ coactivator-1α (PGC-1α) content, lipid, and glycogen in ob/ob plantar flexor complex muscle. After 14 days of treatment with AICAR (0.5 mg·g body wt−1·day−1) in saline or saline injections and a 12-h fast, equal protein from 14-wk-old lean and ob/ob male mouse plantar flexor complex muscle homogenates was subjected to Western blot analysis for nuclear PGC-1α, and data were normalized to β-tubulin (expressed as percentage of LC; A); 10-μm sections from lean and ob/ob male mouse plantar flexor complex muscle were analyzed for lipid and glycogen staining intensity by Oil Red O (ORO) and periodic acid-Schiff (PAS) staining, respectively (B). Representative Western blots are shown. AU, arbitrary units. Values are means ± SE (n = 8 per group). Means with different letters (a, b, and c) are statistically different from one another for the respective variable (P < 0.05).
TSC2.
The integration and regulation of AMPK, mTOR, and Akt signaling relies on the association of TSC2 and TSC1. Therefore, we performed TSC2 immunoprecipitations to examine its interaction with TSC1 and the phosphorylation status of TSC2. Basal, fasted levels of TSC1 associated with TSC2 were lower in OC mice than all other groups (Fig. 3). The 14-day AICAR treatment increased the basal, fasting association of TSC1 with TSC2 in lean and obese mice (LA and OA groups; Fig. 3). There were no differences between groups when we examined the Akt/PKB-sensitive site T1462 on TSC2 from the TSC2 immunoprecipitation (Fig. 3, see Supplemental Table S1).
Fig. 3.

Short-term treatment (14 days) with AICAR normalizes association of tuberous sclerosis (TSC)-1 with TSC2 in ob/ob plantar flexor complex muscle. After 14 days of treatment with AICAR (0.5 mg·g body wt−1·day−1) in saline or saline injections and a 12-h fast, equal protein from lean and ob/ob male mouse plantar flexor complex muscle homogenates was immunoprecipitated with an TSC2 antibody, immunoprecipitates (IP) were assessed for TSC1 and TSC2 content by immunoblot (Western blot) analysis, and the ratio of TSC1 to TSC2, as well as phosphorylation of TSC2 on T1462, was calculated. Results are expressed as percentage of LC. Representative Western blots are shown. At least 2 samples from each group were run on each gel for analysis. Values are means ± SE (n = 6–8 per group). Means with different letters (a, b, and c) are statistically different from one another (P < 0.05).
TORC1 signaling.
A major regulator of cell size, the mTOR protein complexes with and activates several components of mRNA translation initiation, which requires the regulatory, rapamycin-sensitive protein raptor binding with mTOR to activate TORC1 substrates. The amount of raptor associated with mTOR from mTOR immunoprecipitates was lower in OC mice than all other groups (Fig. 4). The amounts of raptor associated with mTOR were similar in OA, LC, and LA mice (Fig. 4). This was not due to any differences in the amounts of total mTOR or raptor protein expression from muscle cell lysate (Fig. 4, see Supplemental Table S1). One of the most heavily characterized mTOR signaling-related proteins is the TORC1 substrate S6K1, and its substrate rpS6 displayed increased phosphorylation in the fasted OC mice (Fig. 5). Similar results with TORC1 signaling were observed in various muscle groups from the lower limb [mixed (gastrocnemius), slow (soleus), and fast (tibialis anterior) contractile-type skeletal muscles] of the ob/ob mice under fasted conditions vs. lean mice (see Supplemental Fig. S1 and Table S1 for quantified data). AICAR treatment for 14 days significantly reduced the fasting levels of S6K1 and rpS6 phosphorylation in LA and OA mice (Fig. 5). We observed similar findings with S6K1 and rpS6 phosphorylation in cardiac muscle lysate samples from LC, LA, OC, and OA mice (see Supplemental Fig. S2).
Fig. 4.

Short-term treatment (14 days) with AICAR normalizes raptor association with mammalian target of rapamycin (mTOR) in ob/ob plantar flexor complex muscle. After 14 days of treatment with AICAR (0.5 mg·g body wt−1·day−1) in saline or saline injections and a 12-h fast, equal protein from lean and ob/ob male mouse plantar flexor complex muscle homogenates was immunoprecipitated with an mTOR antibody. Immunoprecipitates were assessed for raptor and mTOR content by immunoblot analysis, and the ratio of raptor to mTOR was calculated. Results are expressed as percentage of LC. Representative Western blots are shown. Total lysate samples from muscle homogenates were subjected to Western blotting for analysis of raptor and mTOR protein content, which was normalized to GAPDH (expressed as a percentage of LC). Values are means ± SE (n = 6–8 per group). Means with different letters (a and b) are statistically different from one another (P < 0.05).
Fig. 5.
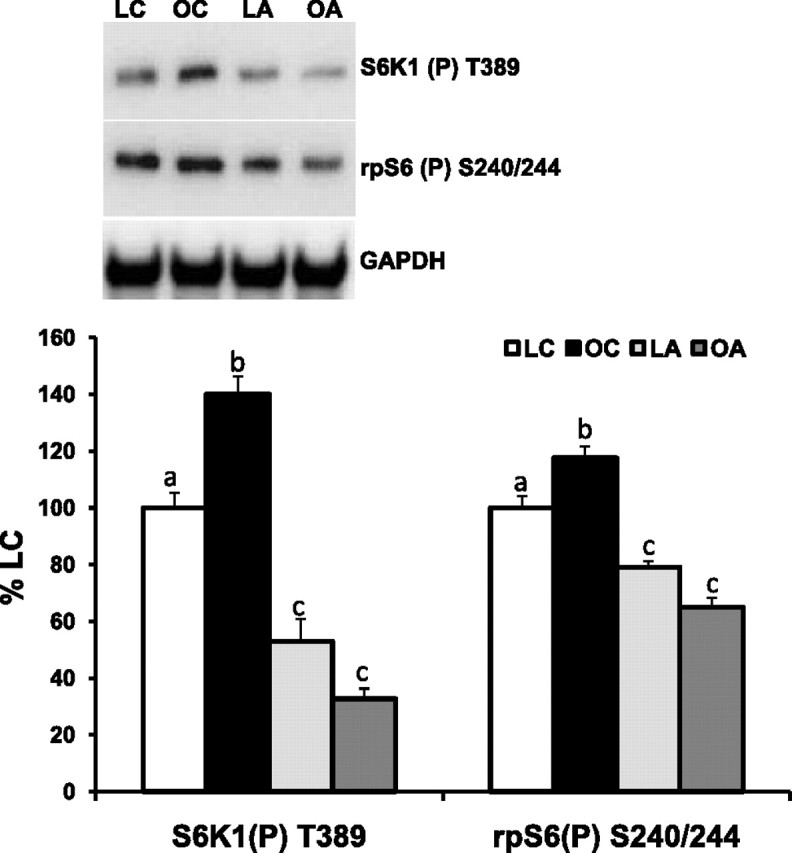
Short-term treatment (14 days) with AICAR normalizes fasted S6 kinase-1 (S6K1) and ribosomal protein S6 (rpS6) phosphorylation in ob/ob plantar flexor complex muscle. After 14 days of treatment with AICAR (0.5 mg·g body wt−1·day−1) in saline or saline injections and a 12-h fast, equal protein from lean and ob/ob male mouse plantar flexor complex muscle homogenates was subjected to Western blot analysis for S6K1 T389 and rpS6 S240/244 phosphorylation sites, and data were normalized to GAPDH (expressed as percentage of LC). Representative Western blots are shown. Values are means ± SE (n = 8 per group). Means with different letters (a, b, and c) are statistically different from one another for the respective variable (P < 0.05).
mRNA translation.
Translation of mRNA into peptides plays a large role in accruing muscle mass. Therefore, we examined components of the translation process. Quantification of sucrose density gradient fractionation of plantar flexor complex muscle (Fig. 6) showed less ribosomal subunit accumulation (40S, 60S, and 80S) and actively translating ribosomes (i.e., polysomes) in obese (OC and OA) than lean (LC and LA) mice (Table 2). Quantification of the total gradient area was significantly less in OC and OA than LC and LA mice (Table 2). We also determined that the areas for the subpolysomal and polysomal portions of the traces were significantly less in the obese (OC and OA) mice (Table 2). The subpolysomal-to-polysomal ratio was higher in OC and OA than LC and LA mice (Table 2) and higher in LA than LC mice. We observed higher 80S peak areas in the lean (LC and LA) than obese (OC and OA) mice, and the 80S peak area did not increase with AICAR treatment in OA compared with OC mice (Table 2).
Fig. 6.

Polysome aggregation from sucrose density gradient of ob/ob plantar flexor complex muscle following short-term treatment (14 days) with AICAR. After 14 days of treatment with AICAR (0.5 mg·g body wt−1·day−1) in saline or saline injections and a 12-h fast, ribosome subunits and polysomes were obtained from lean and ob/ob male mouse plantar flexor complex muscle. Briefly, ribosome subunits and polysomes were clarified by a series of centrifugations, then the gradient was displaced upward through a spectrophotometer, and results are shown as absorbance at 254 nm. A representative profile from each condition is presented. Peaks corresponding to 40S and 60S ribosomal subunits, 80S monomers, and polysomes are shown (n = 8 per group).
Table 2.
Sucrose density gradient fractionation and RNA content in lean and ob/ob mice
| LC | LA | OC | OA | |
|---|---|---|---|---|
| Total sucrose gradient area, AU | 30,101 ± 343a | 28,674 ± 988a | 17,452 ± 500b | 18,501 ± 570b |
| Subpolysomal area, AU | 10,816 ± 767a | 11,184 ± 766a | 7,890 ± 236b | 7,562 ± 165b |
| Polysomal area, AU | 10,253 ± 401a | 8,947 ± 245a | 4,261 ± 322b | 4,078 ± 306b |
| Subpolysomal-to-polysomal ratio | 1.06 ± 0.07a | 1.25 ± 0.11b | 1.85 ± 0.21c | 1.85 ± 0.18c |
| 80S area, AU | 2,801 ± 242a | 2,485 ± 140a | 934 ± 106b | 1,175 ± 48c |
| Total RNA, mg | 1.33 ± 0.02a | 1.28 ± 0.01a | 1.10 ± 0.05b | 1.16 ± 0.02c |
| Ribosome-associated RNA, %total RNA | 6.2 ± 0.1a | 4.9 ± 0.3b | 4.2 ± 0.2c | 5.2 ± 0.1b |
Values are means ± SE (n = 8 per group). Total sucrose gradient area includes free mRNA area.
AU, arbitrary units.
Means with different letters (a, b, and c) are statistically different from one another for the respective variable (P < 0.05).
Consistent with these findings, total RNA content of the plantar flexor complex was lower in the fasted OC than fasted lean (LC and LA) mice (Table 2). However, total RNA concentration increased in OA compared with OC mice but was still lower than in all lean groups. Because <10% of total RNA is being translated under fasted conditions (25), we examined ribosome-associated RNA content from the polysome fraction of sucrose gradients. As suggested by our sucrose density gradient profile data in Table 2, plantar flexor complex muscle ribosome-associated RNA content was lower in OC than LC mice (Table 2). AICAR treatment slightly reduced and increased the ribosomal RNA content in LA and OA mice, respectively (Table 2), to comparable levels that were still lower than in LC mice.
While S6K1 contributes to the regulation of initiation of mRNA translation, eEF2 is a substrate of S6K1 that regulates elongation during mRNA translation. However, the phosphorylation of eEF2 on T56 was not different between groups (Fig. 7). After 14 days of control or AICAR-treated conditions, translation initiation complex (i.e., eIF4F) formation was examined in eIF4E immunoprecipitates from plantar flexor complex muscle lysates. Levels of eIF4G and phosphorylated eIF4G in eIF4E immunoprecipitates were lower in faster OC mice (Fig. 8). AICAR treatment for 14 days significantly increased eIF4G, phosphorylated eIF4G, and 4E-BP1 associated with eIF4E in OA mice (Fig. 8). LA mice showed decreased and increased levels of eIF4G and 4E-BP1 associated with eIF4E (Fig. 8), respectively, similar to OA mice.
Fig. 7.

Short-term treatment (14 days) with AICAR normalizes fasted eukaryotic elongation factor 2 (eEF2) phosphorylation in ob/ob plantar flexor complex muscle. After 14 days of treatment with AICAR (0.5 mg·g body wt−1·day−1) in saline or saline injections and a 12-h fast, equal protein from lean and ob/ob male mouse plantar flexor complex muscle homogenates was subjected to Western blot analysis for eEF2 T56 phosphorylation site, and data were normalized to GAPDH (expressed as percentage of LC). Representative Western blots are shown (n = 8 per group). Means sharing the same letter are not statistically different from one another (P > 0.05).
Fig. 8.

Short-term (14 days) treatment with AICAR normalizes translation initiation eukaryotic initiation factor 4F (eIF4F) complex formation and eIF4G phosphorylation in ob/ob plantar flexor complex muscle. After 14 days of treatment with AICAR (0.5 mg·g body wt−1·day−1) in saline or saline injections and a 12-h fast, equal protein from lean and ob/ob male mouse plantar flexor complex muscle homogenates was immunoprecipitated with an eIF4E antibody, and immunoprecipitates were assessed for eIF4G, 4E-binding protein 1 (4E-BP1), and eIF4E content by immunoblot analysis, and ratios of eIF4G to eIF4E and 4E-BP1 to eIF4E were calculated. Results are expressed as percentage of LC. Representative Western blots are shown. At least 2 samples from each group were run on each gel for analysis. Values are means ± SE (n = 8 per group). Means with different letters (a, b, and c) are statistically different from one another for the respective variable (P < 0.05).
DISCUSSION
The results from the present study show that short-term treatment of ob/ob (obese) mice with AICAR abates the hyperactive, fasted-state mTOR signaling. This is associated with improvements in translational capacity (increases in eIF4F complex formation, total RNA, and ribosomal-associated RNA) and significant increases in plantar flexor complex muscle mass and fiber area. Consistent with the aforementioned findings, we show that metabolic markers from the blood (e.g., glucose and insulin) and skeletal muscle (e.g., neutral lipids, glycogen, and PGC-1α) improved to levels that approached those in lean mice after the short-term AICAR treatment.
The mTOR inhibitor rapamycin has well-established inhibitory properties of growth-promoting and insulin-sensitive pathways during short-term (6, 61) and long-term (46) treatment protocols. Given the propensity of obese animals toward enhanced basal mTOR signaling activation (27, 36, 60), treatment with the mTOR inhibitor rapamycin should act as a prophylactic to obesity-related problems. Despite protection against adiposity and an inhibition of obesity and/or high-fat diet-induced mTOR signaling, rapamycin treatment did not improve insulin sensitivity and glucose tolerance in these models of obesity (12, 36, 43) because of its most frequent side effect, hyperlipidemia (52). Therefore, we sought to counter the harmful effects of obesity on skeletal muscle by treatment with a well-established AMPK agonist-mTOR antagonist that would not have the harmful lipotoxic side effect of rapamycin. Skeletal muscles that are dyslipidemic, type 2 diabetic, and/or obese are less responsive to growth-promoting stimuli (14, 15, 47). Previous data (18, 23, 39) show that obesity-related issues of dyslipidemia, glucose intolerance, and insulin insensitivity were improved with AICAR treatment. AICAR treatment also inhibits mTOR signaling in muscle (8, 62). Hence, treatment of obese mice with the AMPK agonist AICAR will normalize fasting-state mTOR signaling and, perhaps, enhance the potential for skeletal muscle to grow.
Much of the previous research (33, 34) on obese skeletal muscle focused on hyperinsulinemia, hyperglycemia, insulin sensitivity, glucose disposal, lipid accumulation/dyslipidemia, and glycogen metabolism and attenuation or reversal of these complications with exercise, insulin sensitizers, AMPK agonists, and PPAR agonists (18, 23, 39, 50). Correspondingly, the present data show that short-term AMPK agonist treatment reduces fasting blood concentrations of glucose and insulin and the content of skeletal muscle lipid and glycogen. Similarly, findings from a muscle-specific knockout of the mTOR-related, rapamycin-sensitive protein raptor (5) include smaller hindlimb muscles and increased glycogen content and systemic glucose intolerance to a glucose load. The limited studies examining the regulation of muscle mass and/or function in models of obesity or high-fat feeding/diet-induced obesity have reported reduced protein synthetic rates also in db/db mice (14, 48), muscle satellite cell proliferation (38, 40), protein synthetic response to feeding (54, 55), polysome aggregation (during overload) (49), eIF4F complex formation (54), and enhanced rates of muscle degradation (48) and muscle protease activity (58). Obesity results in muscle atrophy, despite an upregulation of the growth-promoting mTOR pathway (27, 36, 60), which was corroborated by the present study. However, skeletal muscle size indexes increased in the ob/ob AICAR-treated mice (vs. ob/ob control mice), but not quite to lean levels. The half-life of mixed mouse muscle (51, 59) may contribute to the limited alterations in mass and/or fiber type in the present and previous studies. Therefore, a significant change in muscle mass with this 14-day intervention should not be expected. It is possible that the duration of our treatment was not sufficient, the measures of muscle growth were not sensitive enough to determine a larger increase in the obese muscle, and/or the obese mice have limited capacity to increase muscle mass. Also, the present study focused only on the plantar flexor complex, consisting of slow, fast, and mixed muscle groups, which is a limitation. A more comprehensive determination of the effects of treatment with an AMPK agonist on skeletal muscle growth-related processes with obesity would require the examination of fiber type- and/or muscle group-specific alterations. Establishment of potential fiber type and/or muscle group differences would facilitate a more targeted approach in the determination of potential therapies for obese skeletal muscle.
The regulation of cap-dependent translation is dependent on TORC1 complex formation (mTOR and raptor), activation of TORC1-sensitive substrates (S6K1, 4E-BP1, rpS6, and eIF4B), and eIF3 (22). In the present study, we show that raptor's association with mTOR is lower in OC than LC mice, which is consistent with the hyperphosphorylated TORC1 signaling in obesity. The raptor-mTOR data are also consistent with the muscle-specific raptor knockout model (5), in that both models have limited muscle strength, size, and oxidative potential. However, the present raptor-mTOR findings are inconsistent with the decreased eIF4F complex formation, polysome aggregation, and RNA content that we observed in the obese mice. This suggests that an essential initiation factor may not be recruited to the preinitiation complex because of dysregulated TORC1 signaling. One explanation for obese skeletal muscle atrophy may be the recruitment of eukaryotic initiation factors to the preinitiation complex. eIF3 is responsible for providing a scaffold for the recruitment of raptor-mTOR to promote the phosphorylation of S6K1 on T389 and eventual recruitment of the eIF4F complex (22). Since S6K1 was hyperphosphorylated in fasted obese muscle, it is unlikely that eIF3 is responsible for the dysregulation of translation.
4E-BP1 showed a significant increase in association with eIF4E in both AICAR-treated groups. 4E-BP1 regulates 40S ribosome binding to mRNA by increasing the availability of eIF4E (65). When 4E-BP1 is phosphorylated, it releases eIF4E to allow binding to eIF4G and, subsequently, to the 40S ribosomal subunit (41, 42). Although 4E-BP1 is primarily regulated by TORC1, the PKC and ERK pathways have also been reported to control 4E-BP1 phosphorylation (21, 30). More in line with the present data, Le Bacquer et al. (32) showed that 4E-BP1 and 4E-BP2 double-knockout mice gained significantly more fat mass than wild-type mice. When a high-fat diet was fed to these 4E-BP1 and 4E-BP2 double-knockout mice, insulin resistance was promoted to a greater extent than in the wild-type mice. In these same double-knockout mice, S6K1 phosphorylation was significantly increased, suggesting that both substrates of TORC1 influence each other (32). The present data also support this finding, given the significant decrease in S6K1 phosphorylation in the AICAR-treated ob/ob mice.
The assembly of the eIF4F complex can depend on the availability of eIF4E and the phosphorylation of eIF4G on S1108 (42). The phosphorylation of eIF4G on S1108 has been shown to enhance eIF4G binding with eIF4E and subsequent protein synthesis (9). The present study supports this contention, because there was a low association of eIF4G with eIF4E and the phosphorylation status of eIF4G-bound eIF4E in obese mouse muscle. Furthermore, AICAR treatment improved both eIF4G (total and phosphorylated) binding with eIF4E and RNA content (total and ribosome-associated) in these obese mice. These improvements with AICAR treatment were associated with normalized (to LC levels) TORC1 signaling changes. These data are supported by the findings of Bolster et al. (9) that leucine-induced increases in protein synthesis were associated with increased eIF4G phosphorylation and eIF4G content in eIF4E immunoprecipitates, independent of changes in S6K1 and 4E-BP1 activation. Other studies (31) also support an mTOR-independent regulation of eIF4G. This would suggest that the regulation of translation initiation in obese skeletal muscle, more specifically eIF4G, may be partially independent of mTOR-S6K1.
Perspectives and Significance
The present study highlights a dysregulation in obese muscle mass and muscle growth regulatory processes and the divergence of response to AICAR between lean and obese muscles. This dysregulation appears to be associated with elevated resting/basal, fasted insulin and glucose concentrations and mTOR signaling differences in the obese muscle. Chronic hyperactivation of mTOR signaling is atypical outside a disease state, such as obesity, dyslipidemia, hypercholesterolemia, or certain types of cancer (13, 17, 27, 37, 44, 60). Therefore, as metabolic parameters were positively altered with 14 days of AICAR treatment (e.g., fasting insulin and glucose and muscle lipid content), pathways and processes, such as mTOR signaling and translation initiation (i.e., total RNA, ribosome-associated RNA, and eIF4F complex formation), were also augmented. Gaining control of these primary events in obese skeletal muscle growth and metabolism may prepare obese muscle to properly adapt to anabolic stimuli (i.e., insulin, IGF, fed state, and exercise). Thus a better understanding of mechanisms by which AMPK activation augments regulators of obese muscle mass under acute fed conditions and longer-term interventions (e.g., endurance exercise models) will aid in design of optimal therapeutic options for the obese population.
GRANTS
This work was supported by West Virginia University School of Medicine Research Development Grant NT10023W (to D. L. Williamson).
DISCLOSURES
No conflicts of interest, financial or otherwise, are declared by the authors.
Supplemental Data
Figure S1 - Fasted TORC1 signaling in lean ob/ob skeletal muscles. Equal protein from lean and ob/ob male mice gastrocnemius, soleus, and tibialis anterior muscle homogenates, fasted for 12 hr, were analyzed by Western blot methods for S6K1 T389, rpS6 S240/244, and/or 4E-BP1 T37/46 phosphorylation sites and normalized to GAPDH. LC=lean control, OC=ob/ob control. Representative Western blots are shown. Quantified data are in Table S1. - .pdf (148 KB)
Figure S2 - Short term (2 wk) AICAR treatment normalizes fasted AMPK and mTOR signaling in ob/ob cardiac muscle. Following 14 days of 0.5mg/g BW/day AICAR in saline or saline injections and a 12 hr fast, equal protein from lean and ob/ob male mice cardiac muscle homogenates were analyzed by Western blot methods for AMPK T172, ACC S79, S6K1 T389, rpS6 S240/244, and 4E-BP1 T37/46 phosphorylation sites and normalized to actin. LC=lean control, LA=lean AICAR, OC=ob/ob control, OA=ob/ob AICAR. Representative Western blots are shown At least two samples from each group were run on each gel for analysis. Quantified data are in Table S1. (n = 8 per group). - .pdf (106 KB)
ACKNOWLEDGMENTS
The authors thank Drs. Kimball and Jefferson and Sharon Rannels for generous help during the sucrose density gradient analysis.
REFERENCES
- 1. Aguilar V, Alliouachene S, Sotiropoulos A, Sobering A, Athea Y, Djouadi F, Miraux S, Thiaudiere E, Foretz M, Voillet B, Diolez P, Bastin J, Benit P, Rustin P, Carling D, Sandri M, Ventura-Clapier R, Pende M. S6 kinase deletion suppresses muscle growth adaptations to nutrient availability by activating AMP kinase. Cell Metab : 476–487, 2007. [DOI] [PubMed] [Google Scholar]
- 2. Alley DE, Chang VW. The changing relationship of obesity and disability, 1988–2004. JAMA : 2020–2027, 2007. [DOI] [PubMed] [Google Scholar]
- 3. Augert G, Van de Werve G, Le Marchand-Brustel Y. Effect of work-induced hypertrophy on muscle glucose metabolism in lean and obese mice. Diabetologia : 295–301, 1985. [DOI] [PubMed] [Google Scholar]
- 4. Benton CR, Han XX, Febbraio M, Graham TE, Bonen A. Inverse relationship between PGC-1α protein expression and triacylglycerol accumulation in rodent skeletal muscle. J Appl Physiol : 377–383, 2006. [DOI] [PubMed] [Google Scholar]
- 5. Bentzinger CF, Romanino K, Cloetta D, Lin S, Mascarenhas JB, Oliveri F, Xia J, Casanova E, Costa CF, Brink M, Zorzato F, Hall MN, Ruegg MA. Skeletal muscle-specific ablation of raptor, but not of rictor, causes metabolic changes and results in muscle dystrophy. Cell Metab : 411–424, 2008. [DOI] [PubMed] [Google Scholar]
- 6. Beretta L, Gingras AC, Svitkin YV, Hall MN, Sonenberg N. Rapamycin blocks the phosphorylation of 4E-BP1 and inhibits cap-dependent initiation of translation. EMBO J : 658–664, 1996. [PMC free article] [PubMed] [Google Scholar]
- 7. Bolster DR, Crozier SJ, Kimball SR, Jefferson LS. AMP-activated protein kinase suppresses protein synthesis in rat skeletal muscle through down-regulated mammalian target of rapamycin (mTOR) signaling. J Biol Chem : 23977–23980, 2002. [DOI] [PubMed] [Google Scholar]
- 8. Bolster DR, Kubica N, Crozier SJ, Williamson DL, Farrell PA, Kimball SR, Jefferson LS. Immediate response of mammalian target of rapamycin (mTOR)-mediated signalling following acute resistance exercise in rat skeletal muscle. J Physiol : 213–220, 2003. [DOI] [PMC free article] [PubMed] [Google Scholar]
- 9. Bolster DR, Vary TC, Kimball SR, Jefferson LS. Leucine regulates translation initiation in rat skeletal muscle via enhanced eIF4G phosphorylation. J Nutr : 1704–1710, 2004. [DOI] [PubMed] [Google Scholar]
- 10. Burnett PE, Barrow RK, Cohen NA, Snyder SH, Sabatini DM. RAFT1 phosphorylation of the translational regulators p70 S6 kinase and 4E-BP1. Proc Natl Acad Sci USA : 1432–1437, 1998. [DOI] [PMC free article] [PubMed] [Google Scholar]
- 11. Campion DR, Purchas RW, Merkel RA, Romsos DR. Genetic obesity and the muscle satellite cell. Proc Soc Exp Biol Med : 143–147, 1984. [DOI] [PubMed] [Google Scholar]
- 12. Chang GR, Chiu YS, Wu YY, Chen WY, Liao JW, Chao TH, Mao FC. Rapamycin protects against high fat diet-induced obesity in C57BL/6J mice. J Pharm Sci : 496–503, 2009. [DOI] [PubMed] [Google Scholar]
- 13. Dowling RJ, Topisirovic I, Fonseca BD, Sonenberg N. Dissecting the role of mTOR: lessons from mTOR inhibitors. Biochim Biophys Acta : 433–439. [DOI] [PubMed] [Google Scholar]
- 14. Durschlag RP, Layman DK. Skeletal muscle growth in lean and obese Zucker rats. Growth : 282–291, 1983. [PubMed] [Google Scholar]
- 15. Fluckey JD, Pohnert SC, Boyd SG, Cortright RN, Trappe TA, Dohm GL. Insulin stimulation of muscle protein synthesis in obese Zucker rats is not via a rapamycin-sensitive pathway. Am J Physiol Endocrinol Metab : E182–E187, 2000. [DOI] [PubMed] [Google Scholar]
- 16. Gautsch TA, Anthony JC, Kimball SR, Paul GL, Layman DK, Jefferson LS. Availability of eIF-4E regulates skeletal muscle protein synthesis during recovery from exercise. Am J Physiol Cell Physiol : C406–C414, 1998. [DOI] [PubMed] [Google Scholar]
- 17. Glazer HP, Osipov RM, Clements RT, Sellke FW, Bianchi C. Hypercholesterolemia is associated with hyperactive cardiac mTORC1 and mTORC2 signaling. Cell Cycle : 1738–1746, 2009. [DOI] [PMC free article] [PubMed] [Google Scholar]
- 18. Halseth AE, Ensor NJ, White TA, Ross SA, Gulve EA. Acute and chronic treatment of ob/ob and db/db mice with AICAR decreases blood glucose concentrations. Biochem Biophys Res Commun : 798–805, 2002. [DOI] [PubMed] [Google Scholar]
- 19. Hardie DG. The AMP-activated protein kinase cascade: the key sensor of cellular energy status. Endocrinology : 5179–5183, 2003. [DOI] [PubMed] [Google Scholar]
- 20. Hardie DG, Pan DA. Regulation of fatty acid synthesis and oxidation by the AMP-activated protein kinase. Biochem Soc Trans : 1064–1070, 2002. [DOI] [PubMed] [Google Scholar]
- 21. Herbert TP, Tee AR, Proud CG. The extracellular signal-regulated kinase pathway regulates the phosphorylation of 4E-BP1 at multiple sites. J Biol Chem : 11591–11596, 2002. [DOI] [PubMed] [Google Scholar]
- 22. Holz MK, Ballif BA, Gygi SP, Blenis J. mTOR and S6K1 mediate assembly of the translation preinitiation complex through dynamic protein interchange and ordered phosphorylation events. Cell : 569–580, 2005. [DOI] [PubMed] [Google Scholar]
- 23. Iglesias MA, Ye JM, Frangioudakis G, Saha AK, Tomas E, Ruderman NB, Cooney GJ, Kraegen EW. AICAR administration causes an apparent enhancement of muscle and liver insulin action in insulin-resistant high-fat-fed rats. Diabetes : 2886–2894, 2002. [DOI] [PubMed] [Google Scholar]
- 24. Inoki K, Li Y, Zhu T, Wu J, Guan KL. TSC2 is phosphorylated and inhibited by Akt and suppresses mTOR signalling. Nat Cell Biol : 648–657, 2002. [DOI] [PubMed] [Google Scholar]
- 25. Kelly FJ, Jefferson LS. Control of peptide-chain initiation in rat skeletal muscle. Development of methods for preparation of native ribosomal subunits and analysis of the effect of insulin on formation of 40S initiation complexes. J Biol Chem : 6677–6683, 1985. [PubMed] [Google Scholar]
- 26. Kemp JG, Blazev R, Stephenson DG, Stephenson GM. Morphological and biochemical alterations of skeletal muscles from the genetically obese (ob/ob) mouse. Int J Obes (Lond) : 831–841, 2009. [DOI] [PubMed] [Google Scholar]
- 27. Khamzina L, Veilleux A, Bergeron S, Marette A. Increased activation of the mammalian target of rapamycin pathway in liver and skeletal muscle of obese rats: possible involvement in obesity-linked insulin resistance. Endocrinology : 1473–1481, 2005. [DOI] [PubMed] [Google Scholar]
- 28. Kim DH, Sarbassov DD, Ali SM, King JE, Latek RR, Erdjument-Bromage H, Tempst P, Sabatini DM. mTOR interacts with raptor to form a nutrient-sensitive complex that signals to the cell growth machinery. Cell : 163–175, 2002. [DOI] [PubMed] [Google Scholar]
- 29. Kubica N, Bolster DR, Farrell PA, Kimball SR, Jefferson LS. Resistance exercise increases muscle protein synthesis and translation of eukaryotic initiation factor 2Bε mRNA in a mammalian target of rapamycin-dependent manner. J Biol Chem : 7570–7580, 2005. [DOI] [PubMed] [Google Scholar]
- 30. Kumar V, Pandey P, Sabatini D, Kumar M, Majumder PK, Bharti A, Carmichael G, Kufe D, Kharbanda S. Functional interaction between RAFT1/FRAP/mTOR and protein kinase Cδ in the regulation of cap-dependent initiation of translation. EMBO J : 1087–1097, 2000. [DOI] [PMC free article] [PubMed] [Google Scholar]
- 31. Lang CH. Elevated plasma free fatty acids decrease basal protein synthesis, but not the anabolic effect of leucine, in skeletal muscle. Am J Physiol Endocrinol Metab : E666–E674, 2006. [DOI] [PubMed] [Google Scholar]
- 32. LeBacquer O, Petroulakis E, Paglialunga S, Poulin F, Richard D, Cianflone K, Sonenberg N. Elevated sensitivity to diet-induced obesity and insulin resistance in mice lacking 4E-BP1 and 4E-BP2. J Clin Invest : 387–396, 2007. [DOI] [PMC free article] [PubMed] [Google Scholar]
- 33. Lindstrom P. The physiology of obese-hyperglycemic mice [ob/ob mice]. Sci World J : 666–685, 2007. [DOI] [PMC free article] [PubMed] [Google Scholar]
- 34. Mayer J, Russell RE, Bates MW, Dickie MM. Metabolic, nutritional and endocrine studies of the hereditary obesity-diabetes syndrome of mice and mechanism of its development. Metabolism : 9–21, 1953. [PubMed] [Google Scholar]
- 35. Merrick WC, Hershey JWB. The pathway and mechanism of eukaryotic protein synthesis. In: Translational Control, edited by , Hershey JWB, Mathews MB, Sonenberg N. Cold Spring Harbor, NY: Cold Spring Harbor Laboratory Press, 1996, p 31–69. [Google Scholar]
- 36. Miller AM, Brestoff JR, Phelps CB, Berk EZ, Reynolds TH. Rapamycin does not improve insulin sensitivity despite elevated mammalian target of rapamycin complex 1 activity in muscles of ob/ob mice. Am J Physiol Regul Integr Comp Physiol : R1431–R1438, 2008. [DOI] [PMC free article] [PubMed] [Google Scholar]
- 37. Ohne Y, Takahara T, Maeda T. Evaluation of mTOR function by a gain-of-function approach. Cell Cycle : 573–579, 2009. [DOI] [PubMed] [Google Scholar]
- 38. Peterson JM, Bryner RW, Alway SE. Satellite cell proliferation is reduced in muscles of obese Zucker rats but restored with loading. Am J Physiol Cell Physiol : C521–C528, 2008. [DOI] [PMC free article] [PubMed] [Google Scholar]
- 39. Pold R, Jensen LS, Jessen N, Buhl ES, Schmitz O, Flyvbjerg A, Fujii N, Goodyear LJ, Gotfredsen CF, Brand CL, Lund S. Long-term AICAR administration and exercise prevents diabetes in ZDF rats. Diabetes : 928–934, 2005. [DOI] [PubMed] [Google Scholar]
- 40. Purchas RW, Romsos DR, Allen RE, Merkel RA. Muscle growth and satellite cell proliferative activity in obese (ob/ob) mice. J Anim Sci : 644–651, 1985. [DOI] [PubMed] [Google Scholar]
- 41. Pyronnet S, Dostie J, Sonenberg N. Suppression of cap-dependent translation in mitosis. Genes Dev : 2083–2093, 2001. [DOI] [PMC free article] [PubMed] [Google Scholar]
- 42. Pyronnet S, Imataka H, Gingras A, Fukunaga R, Hunter T, Sonenberg N. Human eukaryotic translation factor 4G (eIF4G) recruits Mnk1 to phosphorylate eIF4E. EMBO J : 270–279, 1999. [DOI] [PMC free article] [PubMed] [Google Scholar]
- 43. Reynolds TH, Cinquino N, Anthony M, Phelps CB, Berk EZ. Insulin resistance without elevated mammalian target of rapamycin complex 1 activity in muscles of mice fed a high-fat diet. J Appl Physiol : 1479–1485, 2009. [DOI] [PMC free article] [PubMed] [Google Scholar]
- 44. Rivas DA, Yaspelkis BB, Hawley JA, Lessard SJ. Lipid-induced mTOR activation in rat skeletal muscle reversed by exercise and 5′-aminoimidazole-4-carboxamide-1β-d-ribofuranoside. J Endocrinol : 441–451, 2009. [DOI] [PMC free article] [PubMed] [Google Scholar]
- 45. Rolland Y, Lauwers-Cances V, Cristini C, Abellan van Kan G, Janssen I, Morley JE, Vellas B. Difficulties with physical function associated with obesity, sarcopenia, and sarcopenic-obesity in community-dwelling elderly women: the EPIDOS (EPIDemiologie de l'OSteoporose) Study. Am J Clin Nutr : 1895–1900, 2009. [DOI] [PubMed] [Google Scholar]
- 46. Sarbassov DD, Ali SM, Sengupta S, Sheen JH, Hsu PP, Bagley AF, Markhard AL, Sabatini DM. Prolonged rapamycin treatment inhibits mTORC2 assembly and Akt/PKB. Mol Cell : 159–168, 2006. [DOI] [PubMed] [Google Scholar]
- 47. Shapira JF, Kircher I, Martin RJ. Indices of skeletal muscle growth in lean and obese Zucker rats. J Nutr : 1313–1318, 1980. [DOI] [PubMed] [Google Scholar]
- 48. Shargill NS, Ohshima K, Bray GA, Chan TM. Muscle protein turnover in the perfused hindquarters of lean and genetically obese-diabetic (db/db) mice. Diabetes : 1160–1164, 1984. [DOI] [PubMed] [Google Scholar]
- 49. Sitnick M, Bodine SC, Rutledge JC. Chronic high fat feeding attenuates load-induced hypertrophy in mice. J Physiol : 5753–5765, 2009. [DOI] [PMC free article] [PubMed] [Google Scholar]
- 50. Song XM, Fiedler M, Galuska D, Ryder JW, Fernstrom M, Chibalin AV, Wallberg-Henrikssen H, Zierath JR. 5-Aminoimidazole-4-carboxamide ribonucleoside treatment improves glucose homeostasis in insulin-resistant diabetic (ob/ob) mice. Diabetologia : 56–65, 2002. [DOI] [PubMed] [Google Scholar]
- 51. Sparrow MP, Earl CA, Laurent GL, Everett AW. Turnover rates of muscle proteins in cardiac, skeletal, and smooth muscle: turnover rate related to muscle function. Recent Adv Stud Card Struct Metab : 29–34, 1976. [PubMed] [Google Scholar]
- 52. Stallone G, Infante B, Grandaliano G, Gesualdo L. Management of side effects of sirolimus therapy. Transplantation : S23–S26, 2009. [DOI] [PubMed] [Google Scholar]
- 53. Stenholm S, Harris TB, Rantanen T, Visser M, Kritchevsky SB, Ferrucci L. Sarcopenic obesity: definition, cause and consequences. Curr Opin Clin Nutr Metab Care : 693–700, 2008. [DOI] [PMC free article] [PubMed] [Google Scholar]
- 54. Svanberg E, Jefferson LS, Lundholm K, Kimball SR. Postprandial stimulation of muscle protein synthesis is independent of changes in insulin. Am J Physiol Endocrinol Metab : E841–E847, 1997. [DOI] [PubMed] [Google Scholar]
- 55. Svanberg E, Zachrisson H, Ohlsson C, Iresjo BM. Role of insulin and IGF-I in activation of muscle protein synthesis after oral feeding. Am J Physiol Endocrinol Metab : E614–E620, 1996. [DOI] [PubMed] [Google Scholar]
- 56. Takano A, Usui I, Haruta T, Kawahara J, Uno T, Iwata M, Kobayashi M. Mammalian target of rapamycin pathway regulates insulin signaling via subcellular redistribution of insulin receptor substrate 1 and integrates nutritional signals and metabolic signals of insulin. Mol Cell Biol : 5050–5062, 2001. [DOI] [PMC free article] [PubMed] [Google Scholar]
- 57. Tremblay F, Gagnon A, Veilleux A, Sorisky A, Marette A. Activation of the mammalian target of rapamycin pathway acutely inhibits insulin signaling to Akt and glucose transport in 3T3–L1 and human adipocytes. Endocrinology : 1328–1337, 2005. [DOI] [PubMed] [Google Scholar]
- 58. Trostler N, Amin R, Shafrir E. Increased protease activity in muscles of obese (ob/ob) mice. Int J Obes : 557–566, 1982. [PubMed] [Google Scholar]
- 59. Tsika RW, Herrick RE, Baldwin KM. Time course adaptations in rat skeletal muscle isomyosins during compensatory growth and regression. J Appl Physiol : 2111–2121, 1987. [DOI] [PubMed] [Google Scholar]
- 60. Um SH, Frigerio F, Watanabe M, Picard F, Joaquin M, Sticker M, Fumagalli S, Allegrini PR, Kozma SC, Auwerx J, Thomas G. Absence of S6K1 protects against age- and diet-induced obesity while enhancing insulin sensitivity. Nature : 200–205, 2004. [DOI] [PubMed] [Google Scholar]
- 61. von Manteuffel SR, Dennis PB, Pullen N, Gingras AC, Sonenberg N, Thomas G. The insulin-induced signalling pathway leading to S6 and initiation factor 4E binding protein 1 phosphorylation bifurcates at a rapamycin-sensitive point immediately upstream of p70s6k. Mol Cell Biol : 5426–5436, 1997. [DOI] [PMC free article] [PubMed] [Google Scholar]
- 62. Williamson DL, Bolster DR, Kimball SR, Jefferson LS. Time course changes in signaling pathways and protein synthesis in C2C12 myotubes following AMPK activation by AICAR. Am J Physiol Endocrinol Metab : E80–E89, 2006. [DOI] [PubMed] [Google Scholar]
- 63. Williamson DL, Butler DC, Alway SE. AMPK inhibits myoblast differentiation through a PGC-1α-dependent mechanism. Am J Physiol Endocrinol Metab : E304–E314, 2009. [DOI] [PMC free article] [PubMed] [Google Scholar]
- 64. Williamson DL, Kubica N, Kimball SR, Jefferson LS. Exercise-induced alterations in extracellular signal-regulated kinases 1/2 and mammalian target of rapamycin (mTOR) to regulatory mechanisms of mRNA translation in mouse muscle. J Physiol : 497–510, 2006. [DOI] [PMC free article] [PubMed] [Google Scholar]
- 65. Williamson DL, Raue U, Slivka DR, Trappe S. Resistance exercise, skeletal muscle FOXO3A, and 85-year-old women. J Gerontol A Biol Sci Med Sci : 335–343, 2010. [DOI] [PMC free article] [PubMed] [Google Scholar]
Associated Data
This section collects any data citations, data availability statements, or supplementary materials included in this article.
Supplementary Materials
Figure S1 - Fasted TORC1 signaling in lean ob/ob skeletal muscles. Equal protein from lean and ob/ob male mice gastrocnemius, soleus, and tibialis anterior muscle homogenates, fasted for 12 hr, were analyzed by Western blot methods for S6K1 T389, rpS6 S240/244, and/or 4E-BP1 T37/46 phosphorylation sites and normalized to GAPDH. LC=lean control, OC=ob/ob control. Representative Western blots are shown. Quantified data are in Table S1. - .pdf (148 KB)
Figure S2 - Short term (2 wk) AICAR treatment normalizes fasted AMPK and mTOR signaling in ob/ob cardiac muscle. Following 14 days of 0.5mg/g BW/day AICAR in saline or saline injections and a 12 hr fast, equal protein from lean and ob/ob male mice cardiac muscle homogenates were analyzed by Western blot methods for AMPK T172, ACC S79, S6K1 T389, rpS6 S240/244, and 4E-BP1 T37/46 phosphorylation sites and normalized to actin. LC=lean control, LA=lean AICAR, OC=ob/ob control, OA=ob/ob AICAR. Representative Western blots are shown At least two samples from each group were run on each gel for analysis. Quantified data are in Table S1. (n = 8 per group). - .pdf (106 KB)