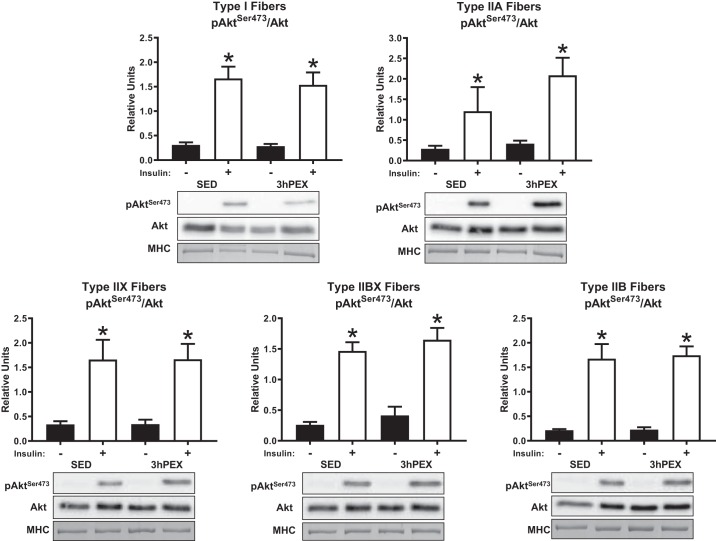
Fig. 4.
Insulin-stimulated pAktSer473/Akt at 3hPEX vs. SED controls in different fiber types from high-fat diet-fed rats. *P < 0.05, indicates insulin significantly greater than no insulin within the same treatment group (SED or 3hPEX). Values are expressed as means ± SE; n = 7–10 per group. Representative blots and loading controls are included for each fiber type. 3hPEX, 3 h postexercise; MHC, myosin heavy chain; SED, sedentary.

