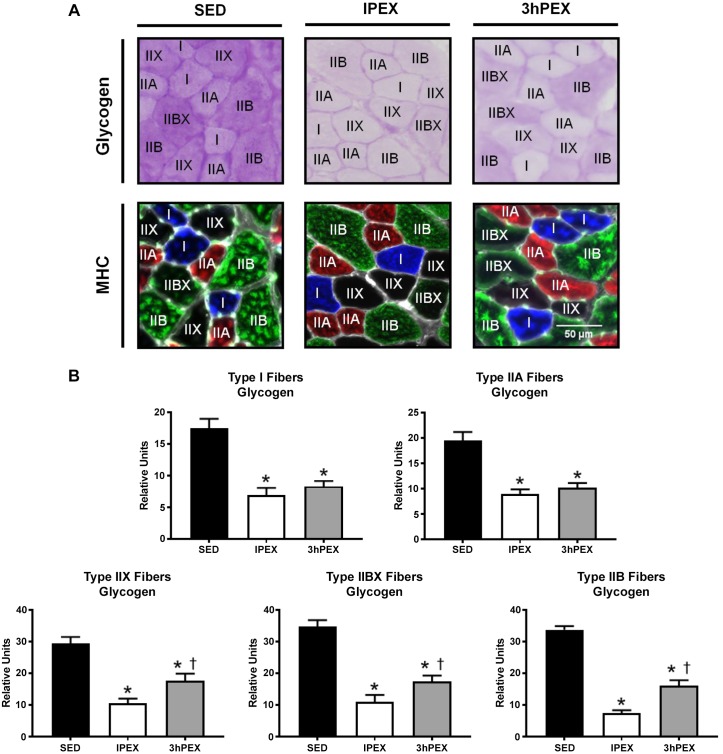
Fig. 9.
Postexercise fiber type-specific glycogen content. A: representative images of serially cross-sectioned rat muscle for identification of glycogen content and fiber type. Glycogen content was determined by PAS stain intensity (darker stain represents higher glycogen content). MHC type I is shown in blue, MHC type IIA is shown in red, MHC type IIB is shown in green, and MHC type IIX is represented by the absence of signal (black). B: quantification of fiber type-specific glycogen content by PAS stain intensity. *P < 0.001, indicates SED significantly greater than both IPEX and 3hPEX. †P < 0.001, indicates 3hPEX significantly greater than IPEX. Values are expressed as means ± SE. The number of rats used for each group in this experiment was n = 6; 51–108 fibers/muscle were used to determine glycogen content. Numbers of fibers (SED, IPEX, 3hPEX) used for glycogen measurement of each fiber type were type I (n = 100, 76, 106), type IIA (n = 117, 133, 123), type IIX (n = 45, 83, 81), type IIBX (n = 42, 37, 54), type IIB (n = 146, 163, 175). MHC, myosin heavy chain; IPEX, immediately postexercise; PAS, periodic acid-Schiff; SED, sedentary; 3hPEX, 3 h postexercise.

