Fig. 2.
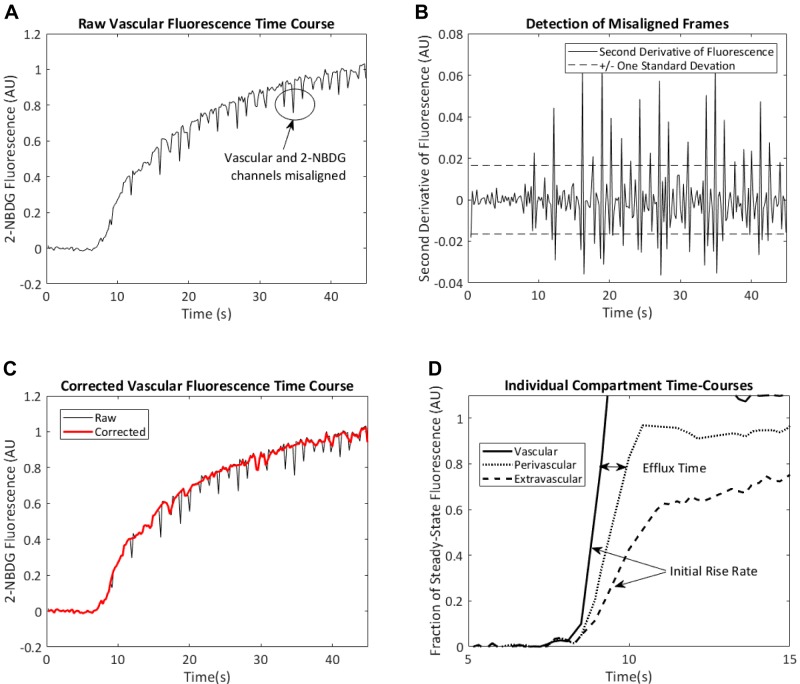
Noise filtering and quantification of 2-NBDG arrival curves. A: motion artifacts result in periodic misalignment of vascular and 2-NBDG channels. B: these misaligned frames produce large spikes in the second derivative of 2-NBDG fluorescence with respect to time. C: removal of frames in which the second derivative of 2-NBDG fluorescence is >1 SD away from 0 results in a smoother 2-NBDG arrival curve. D: after removal of the misaligned frames, the initial rates of increase of 2-NBDG fluorescence in the vascular and extravascular channels were used as indexes of blood flow and glucose delivery, respectively. The time delay between 80% steady-state vascular fluorescence and 80% steady-state perivascular fluorescence (i.e., efflux time) is recorded as an index of time delay required for transendothelial 2-NBDG efflux. AU, aribtrary units.

