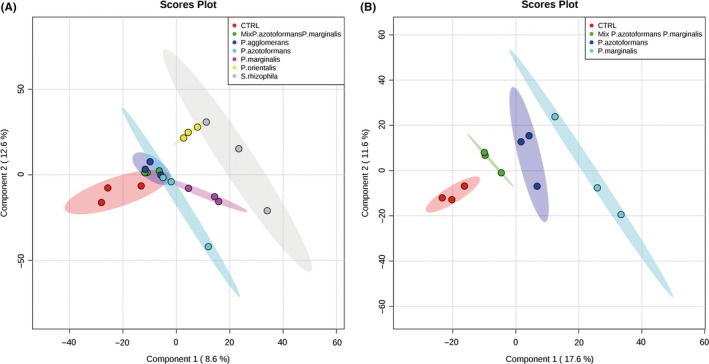
Figure 7.

PLSDA 2D‐plot of volatile organic compounds emitted by mono‐ and mixed‐cultures of endophytic bacteria. (A) GC‐MS data obtained from monocultures of P. agglomerans, P. marginalis, P. azotoformans, P. orientalis and S. rhizophila and the control (no bacterial volatile exposure) and the mixed culture of P. azotoformans and P. marginalis (mixture). (B) GC‐MS data of volatiles emitted by the isolates used in herbivory resistance experiments and plant‐growth promoting experiment, monoculture of P. azotoformans and P. marginalis and the mixture of both
