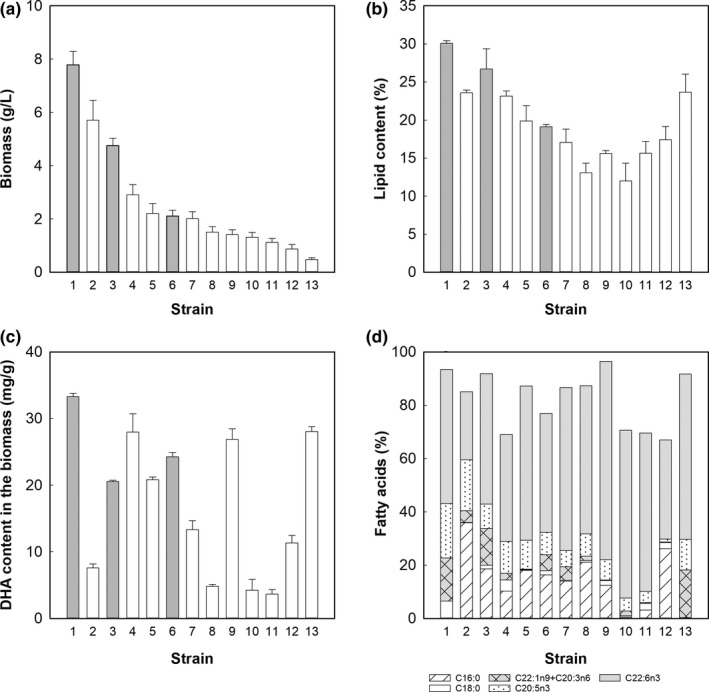
Figure 2.

Biomass concentration (a), lipid content of the biomass (b), fatty acid composition of the total lipids (c), and DHA content of the biomass of the Antarctic thraustochytrids (d). Gray and white bars in a, b, and c correspond to the strains cultivated at 5 and 20°C, respectively. The strains are (1) RT2316‐13, (2) RT2316‐12, (3) RT2316‐11, (4) RT2316‐4, (5) RT2316‐6, (6) RT2316‐8, (7) RT2316‐7, (8) RT2316‐9, (9) RT2316‐3, (10) RT2316‐2, (11) RT2316‐1, (12) RT2316‐5, (13) RT2316‐10
