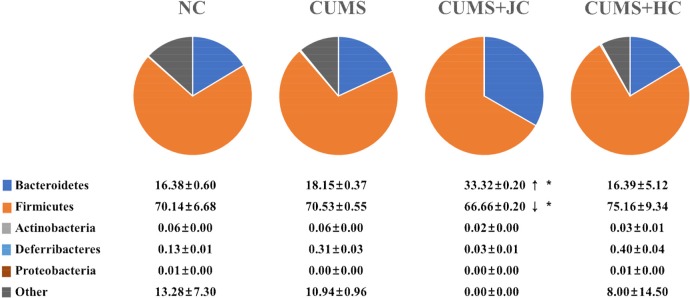
Fig. 3. Change(s) in the gut microbial population by cheese intake in CUMS mice.
The mice fecal samples were analyzed with quantitative polymerase chain reaction (qPCR) assay, and the cycle threshold (CT) values were used to calculate the proportion of higher bacterial taxa. Communities’ characterization is also displayed in the pie chart. Asterisk (*) indicates significant differences among groups (p<0.05). NC, no cheese; CUMS, chronic, unpredictable, mildly stressed; JC, Jersey cheese; HC, Holstein cheese.

