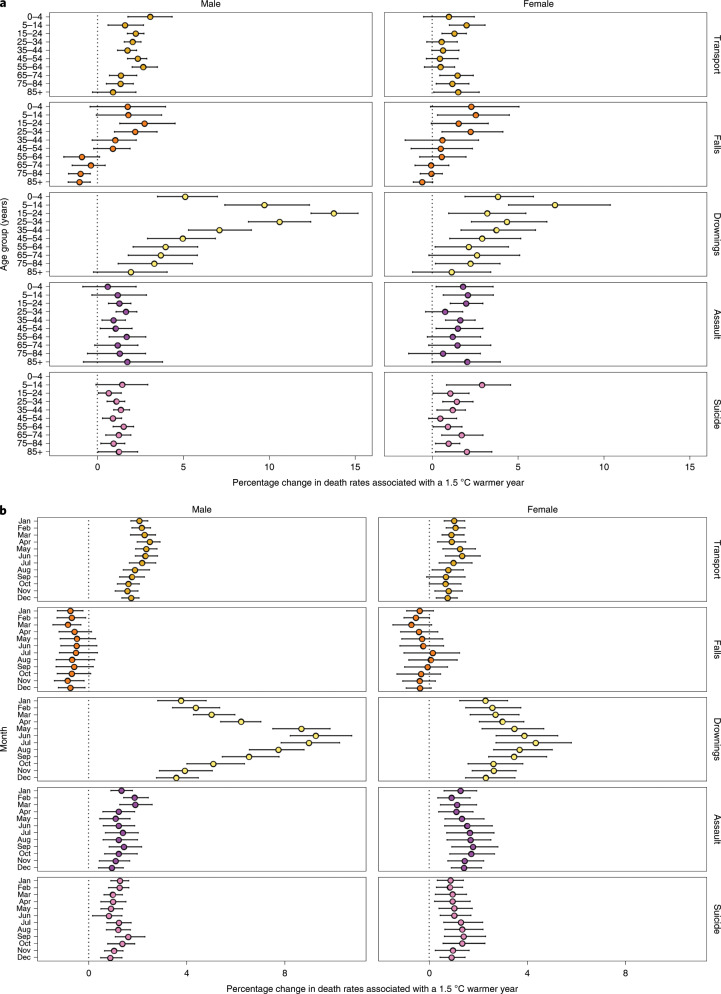
Fig. 4. Percentage change in death rates in year in which each month was +1.5 °C compared with 1980–2017 average temperatures by type of injury, sex and age group or month.
a, Percentage change in death rates by injury, sex and age group. b, Percentage change in death rates by injury, sex and month. Colored dots show the posterior means and error bars represent 95% credible intervals, both obtained at the posterior draw level. See Extended Data Fig. 4 for the scenario of 2 °C warmer.

