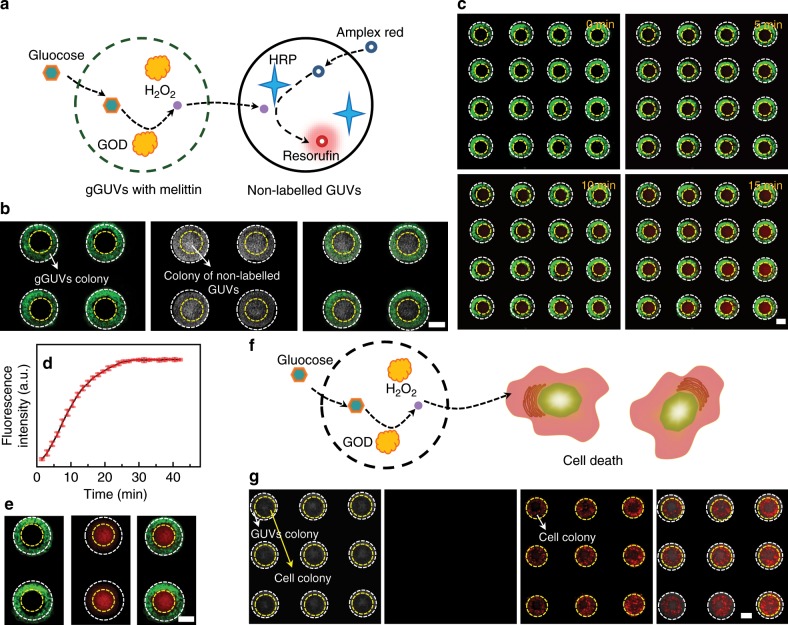
Fig. 4. Spatialized biochemical reactions in tissue-like GUVs aggregates.
a Schematic illustration for the chemical communication between the colony of gGUVs with melittin and the non-labeled GUVs colony. b Fluorescence image and bright field image of the GUVs aggregates with two coaxial GUVs colonies: fluorescence image of the colonies of gGUVs with melittin (left), bright field image of the two kind of colonies (middle), merged image (right). c Fluorescence images of the GUVs aggregates against time after the biochemical reaction was initiated by the addition of glucose and Amplex Red. d Variation of the fluorescence intensity of the product against time. The error bar represents the standard error of mean (SEM), n = 3 independent experiments. e Fluorescence images of the tissue-like GUVs aggregates with fluorescent resorufin product: fluorescent image of gGUVs colony (left), fluorescent image of the product of resorufin (middle), merged image (right). f Schematic illustration of the cell death caused by H2O2 that is generated by the GUVs colonies. g Images for the H2O2 caused cell death: bright field image of GUVs colonies and cell colonies (the first one), fluorescence image of live cells (the second one), fluorescence image of dead cells (the third one), and merged image (the last one). GOD in a and f represents glucose oxidase. HRP in a represents horseradish peroxidase. The scale bars were 100 μm. Source data are provided as a Source Data file.

