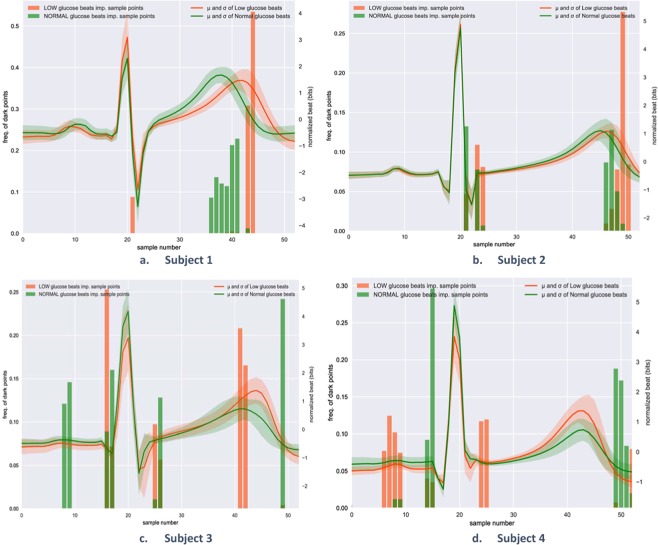
Figure 4.
Identification of the most relevant heartbeat segments for hypoglycemia detection using Grad-CAM method. The solid lines represent the mean of all the heartbeats that correspond to each subject in the training dataset: green during normal glucose levels, red during hypoglycemic events. The comparison among 4 different subjects highlighted the fact that each subject may have a different ECG waveform during hypoglycemic events for instance Subjects 1 and 2 present a visibly longer QT interval during hypoglycemic events, differently from subjects 3 and 4. The error bands represent the standard deviation of the considered heartbeats. The vertical bars represent the histograms of the sample points that were >0.9 in the normalised heatmaps obtained from applying Grad-CAM methods on all the training heartbeats.

