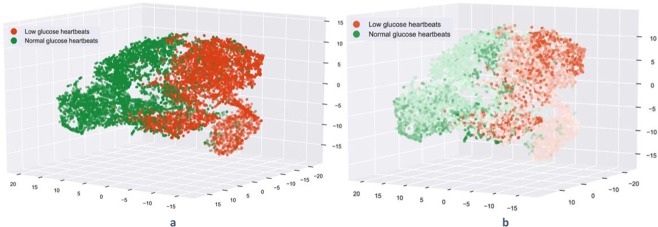
Figure 5.
t-SNE visualisation of the test heartbeats corresponding to subject 3 in the activation space representation. The red heartbeats correspond to a low glucose level (<4.0 mmol/L) and the green heartbeats that correspond to normal glucose levels. a. t-SNE visualisation when the heartbeats are coloured according to the glucose annotation(class) b. t-SNE visualisation using a colour map that shows the glucose value associated with each heartbeat, the darker the colour the higher the glucose value for normal beats and the lower for low glucose beats.

