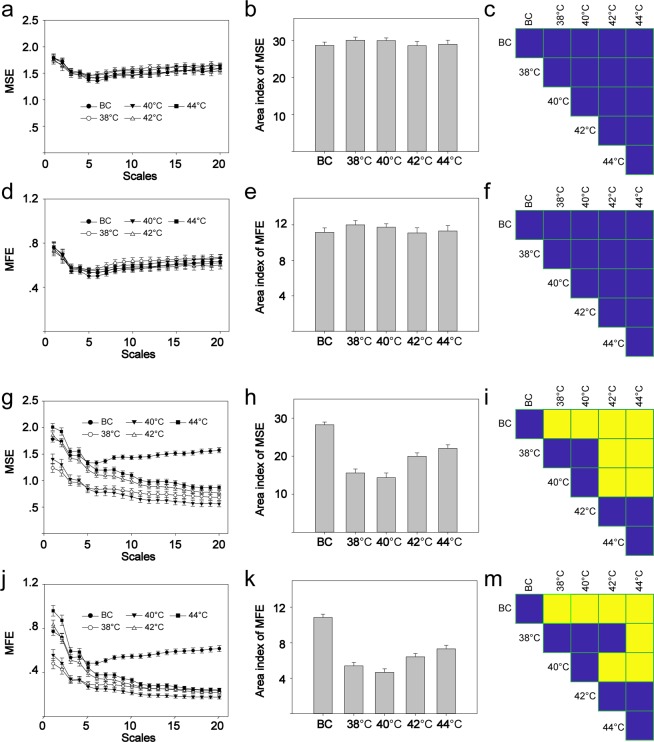
Figure 3.
The complexity of oxygen saturation signals. The left column is the curve of MSE/MFE. The middle column is the CAI. The right column is the multiple comparisons. (a) MSE before stimulation. (b)MSE CAI before stimulation. (c) Comparison of MSE CAI before stimulation, F(4,141) = 0.5776, P = 0.6794. (d) MFE before stimulation. (e) MFE CAI before stimulation. (f) Comparison of MFE CAI before stimulation, F(4,141) = 0.5756, P = 0.6808. (g) MSE after stimulation. (h) MSE CAI after stimulation. (i) Comparison of MSE CAI after stimulation, F(4,141) = 32.38, P < 0.01. (j) MFE after stimulation. (k) MFE CAI after stimulation. (m) Comparison of MFE CAI after stimulation, F(4,141) = 39.64, P < 0.01. Yellow indicates P < 0.05, and blue indicates P > 0.05. MSE, multiscale entropy; CAI, complexity area index; MFE, multiscale fuzzy entropy. BC, blank control. Data are presented as the mean ± SE.

