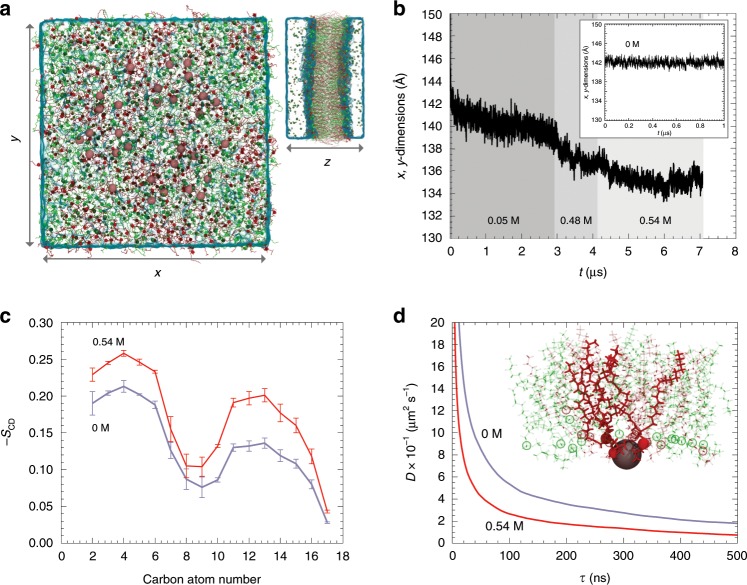
Fig. 6. Molecular dynamics simulation (MDS) of a DOPC/DOPS bilayer exposed to a Ca2+-lattice, extreme Ca2+-concentrations and in absence of Ca2+.
a Top and side views of the computational assay. DOPC and DOPS lipids are shown in green and red, respectively. Calcium, sodium, and chloride are shown as pink, yellow, and blue van der Waals spheres. b Time evolution of the x, y-dimensions of the simulation cell at increasing calcium concentration. Reference assay devoid of calcium (inset). c Order parameter of the DOPC lipids in the reference assay devoid of calcium (lavender) and at high calcium concentration (red), determined as averages over sn-1 and sn-2 chains, in a time frame of 1 µs. Each data represent for mean ± s.d. of the order parameter. d Diffusivity of DOPS lipids measured from their mean-squared displacement over a period of 1 µs. Typical configuration of a calcium ion chelated by DOPS (inset).

