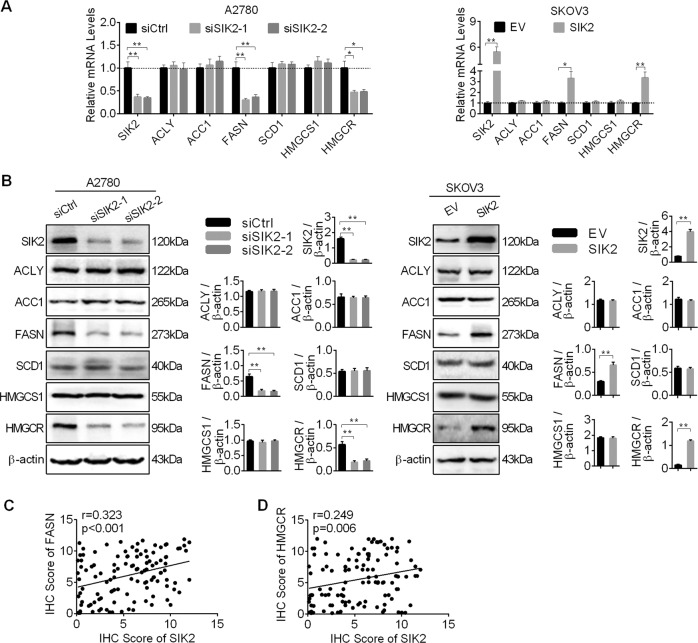
Fig. 2. SIK2 upregulated the expressions of lipogenic enzymes in OC cells.
a Quantitative RT-PCR analysis for mRNA expression levels of lipogenic enzymes ACLY, ACC1, FASN, SCD1, HMGCS1 and HMGCR in A2780 and SKOV3 cells with treatment as indicated. b Western blot analysis for protein expression levels of lipogenic enzymes of ACLY, ACC1, FASN, SCD1, HMGCS1 and HMGCR in A2780 and SKOV3 cells with treatment as indicated. c, d Spearman correlation analysis of the relationship between the protein expression levels of SIK2 and FASN, as well as between SIK2 and HMGCR based on IHC staining results. Data are shown as mean ± S.E.M from three independent experiments. *p < 0.05; **p < 0.01.

