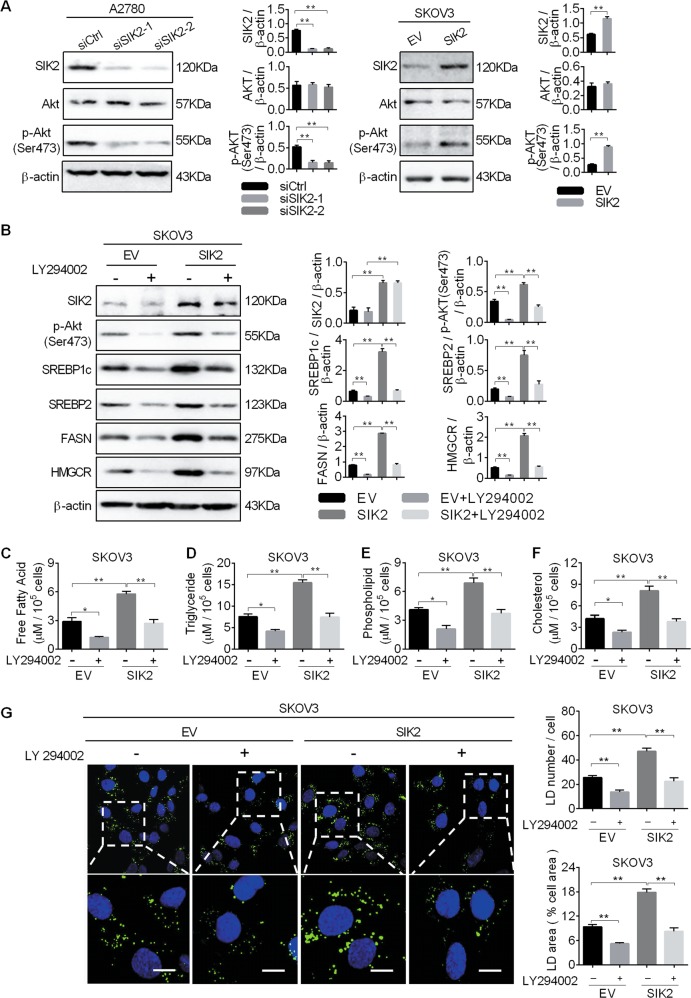
Fig. 5. SIK2 promoted the upregulation of SREBP1c and SREBP2 by activating the PI3K/Akt signaling pathway.
a Western blot analysis for total Akt and phosphorylated Akt (Ser473) in A2780 and SKOV3 cells with treatment as indicated. b Western blot analysis for expression of p-Akt (Ser473), SREBP1c, SREBP2, FASN and HMGCR in SKOV3 cells treated with an Akt inhibitor LY294002 (LY294002, 5 μM PI3K/Akt signaling inhibitor for 12 h). c–f Cellular content of free fatty acid (c), triglyceride (d), phospholipids (e) and cholesterol (f) were detected in SKOV3 treated with Akt inhibitor LY294002. g The content of neutral lipids were detected by BODIPY 493/503 dye and counterstained with DAPI in SKOV3 cells treated with Akt inhibitor LY294002. Scale bars, 50μm. Average numbers of LDs per cell (upper panel), percentage of cellular area occupied by LDs (lower panel). Data are shown as mean ± S.E.M from three independent experiments. *p < 0.05; **p < 0.01.

