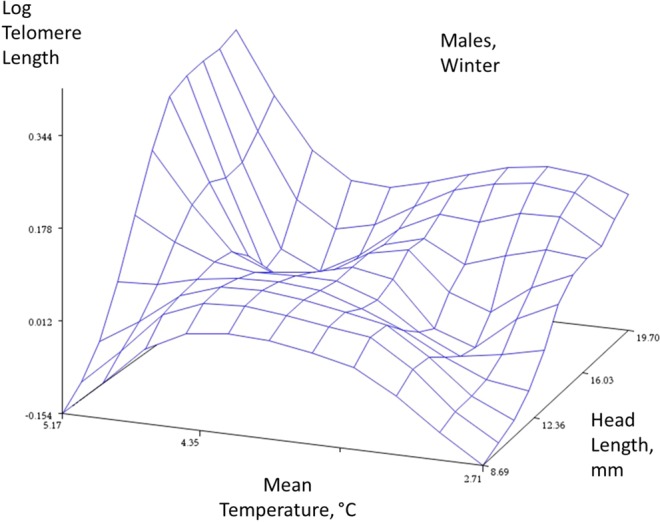
Figure 2.

Winter data, males. Response surface plots with a spline function to describe the relationships between an index of age (head length, mm), mean temperature, and telomere length (log T/S ratio) in the two sexes (females, males) and two seasons (winter and summer). The spline function ‘smooths’ the plot to help reveal the complex relationship between these three traits (smoothing parameter = 0.5). The plot is descriptive and not directly associated with a statistical analysis.
