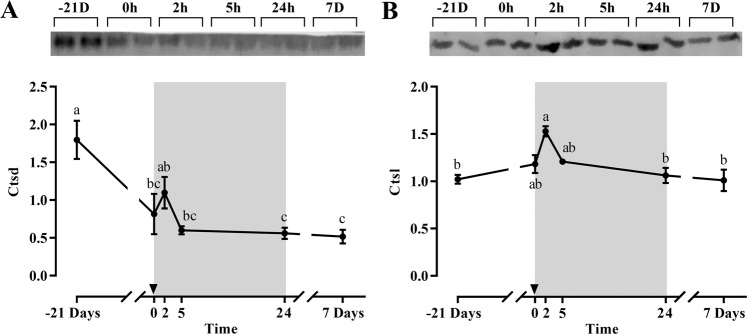
Figure 5.
Representative blot and densiometric protein levels of skeletal white muscle Ctsd (A) and Ctsl (B) in gilthead sea bream during the fasting and refeeding experiment. Each protein was analyzed in cropped membranes of different Western blots along with other proteins (data not shown). The intensity of each specific band was normalized by the total transferred protein. The postprandial period is shown in grey and the time in hours. Data are shown as means ± SEM (n = 6). Letters indicates significant differences (p < 0.05) by one-way ANOVA, LSD and Tukey HSD test.

