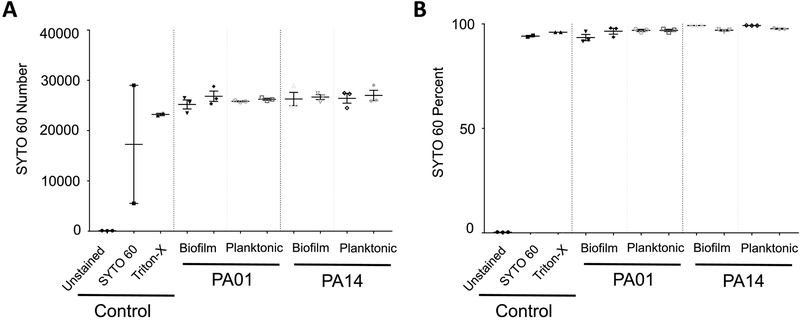
Figure 2.
SYTO 60 Analysis by Flow Cytometry.
Two bacteria strains, WT PA01 and PA14, were cultured by shaking to generate planktonic cultures (3h) or under static conditions to generation biofilm cultures (1d). Bacteria were stained with SYTO 60 and TOTO-1 and processed for flow cytometry. Cumulative data includes, from L to R: unstained, SYTO 60 only, and Triton-X control for WT PA01. Panel A is direct counts and Panel B is percent of cells in bacteria gate. All samples were gated on SSC/FSC and threshold level set to SSC 200. The experiment was performed in triplicate and independently repeated.

