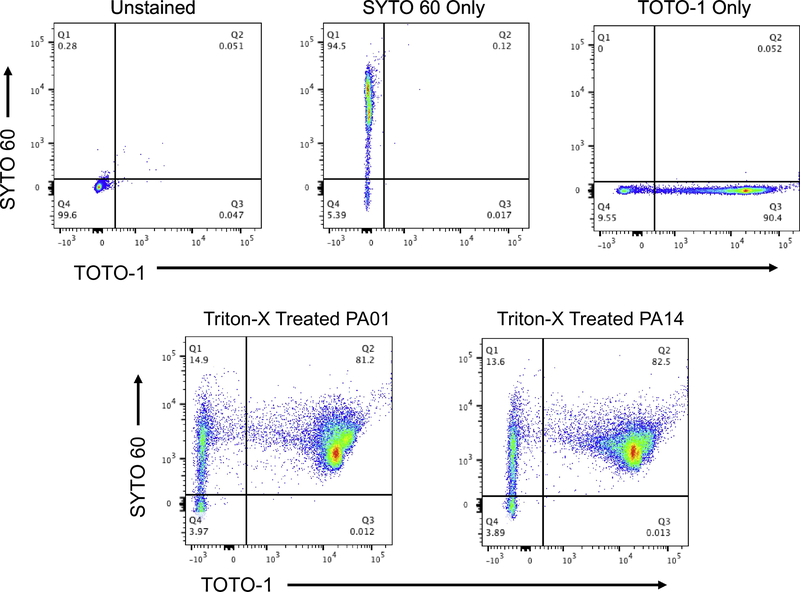
Figure 4.
Experimental Controls including Detergent Treated Cells assayed by Flow Cytometry. Bacteria were cultured by shaking to generate planktonic cells (3h).
Bacteria were stained with SYTO 60 and TOTO-1 and processed for flow cytometry. The top panels feature specificity controls, from L to R: unstained, SYTO 60 only, and TOTO-1 only. The bottom panels: Triton-X 100 pretreated (30 min, 10% Triton-X 100 prior to staining) planktonic culture WT PA01 (L); and planktonic culture PA14 (R). All samples were gated on SSC/FSC and threshold level set to SSC 200. Representative images for three independent experiments are shown.

