Figure 4.
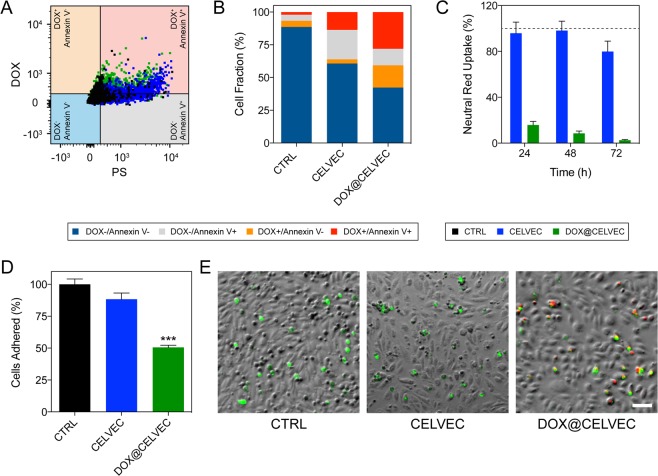
Effect of DOX loading in CELVEC performance. (A) Flow cytometry dot plot depicting PS on CELVEC (blue) and DOX@CELVEC (green) surface 4 h post-generation. (B) Quantitative assessment of flow cytometry dot plot data exhibiting DOX and Annexin V positive cells using gates established in (A). (C) Cytotoxic evaluation of murine macrophage cells following electroporation (CELVEC, blue) and electroporation supplemented with DOX (DOX@CELVEC, green) to create DOX@CELVEC. Neutral red uptake was employed to evaluate cellular viability and proliferation over 72 h. Doxorubicin loading was performed at 20 mg/mL. Values normalized to untreated murine macrophages (CTRL). (D) Quantification of CELVEC adhered to TNF-α-activated HUVEC following 30 min of in vivo-like flow conditions of 0.1 dyn/cm2. (E) Representative fluorescent microscope images used for (D,E) depicting CELVEC adhesion following 30 min. of flow. Scale bar, 100 μm. The data is plotted as the mean ± SEM. ***p < 0.001.

