Figure 2.
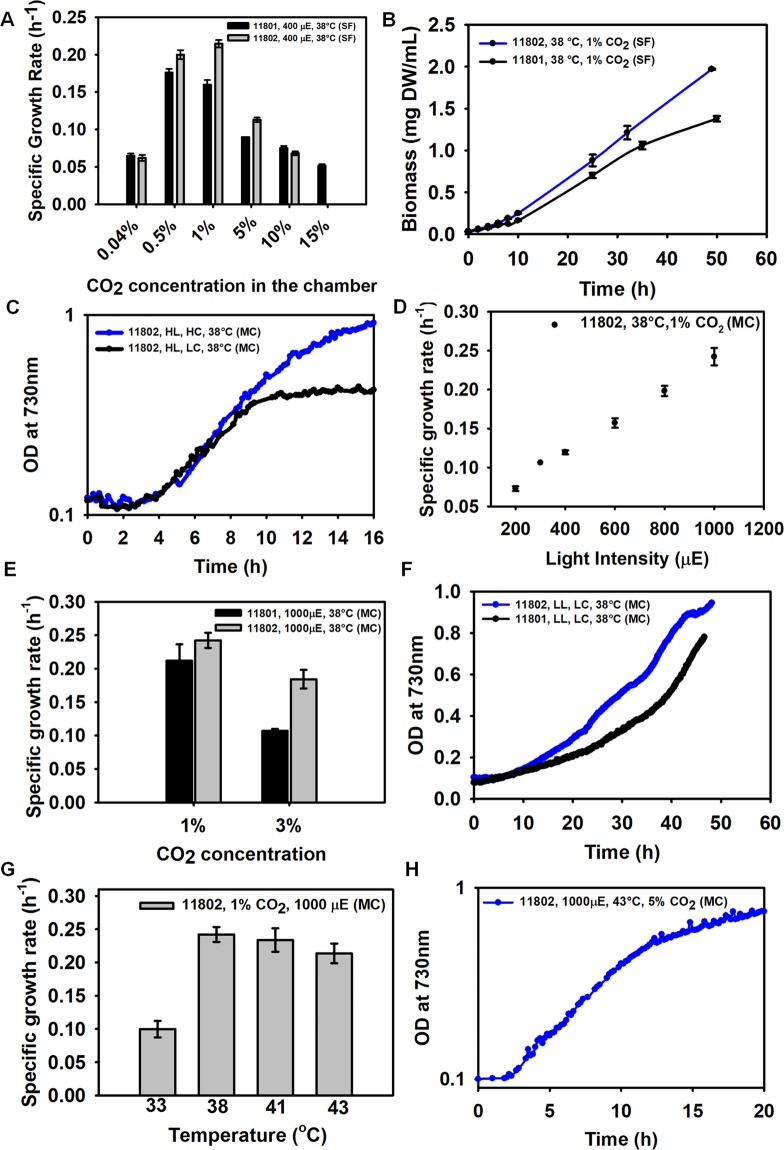
Growth characterization of PCC 11802 and comparison with PCC 11801. (A) The growth rates of PCC 11802 and 11801 in shake flasks (SF) under 400 µmole photons.m−2.s−1, 38 °C and varied CO2 levels in the chamber, (B) biomass accumulation of PCC 11802 compared to that of PCC 11801 at 1% CO2 in SF, (C) growth of PCC 11802 at high light (HL, 1000 µmole photons.m−2.s−1), high CO2 (HC, 1% CO2) compared with growth at high light (HL) and low CO2 (LC, 0.04% CO2) at 38 °C in MC, (D) dependence of specific growth rate of PCC 11802 on the light intensity at 38 °C and 1% CO2 in MC, (E) specific growth rates of PCC 11802 compared to PCC 11801 at high light (1000 µmole photons.m−2.s−1) and high CO2 concentrations (1% and 3%) at 38 °C in MC, (F) comparison of growth of PCC 11802 to PCC 11801 under low light (LL, 200 µmole photons.m−2.s−1) and low CO2 (LC, 0.04% CO2) at 38 °C, (G) specific growth rates of PCC 11802 at varying temperatures at 1000 µmole photons.m−2.s−1 and 1% CO2 in MC, and (H) growth profile of PCC 11802 at 1000 µmole photons.m−2.s−1, 43 °C and 5% CO2 in MC.

