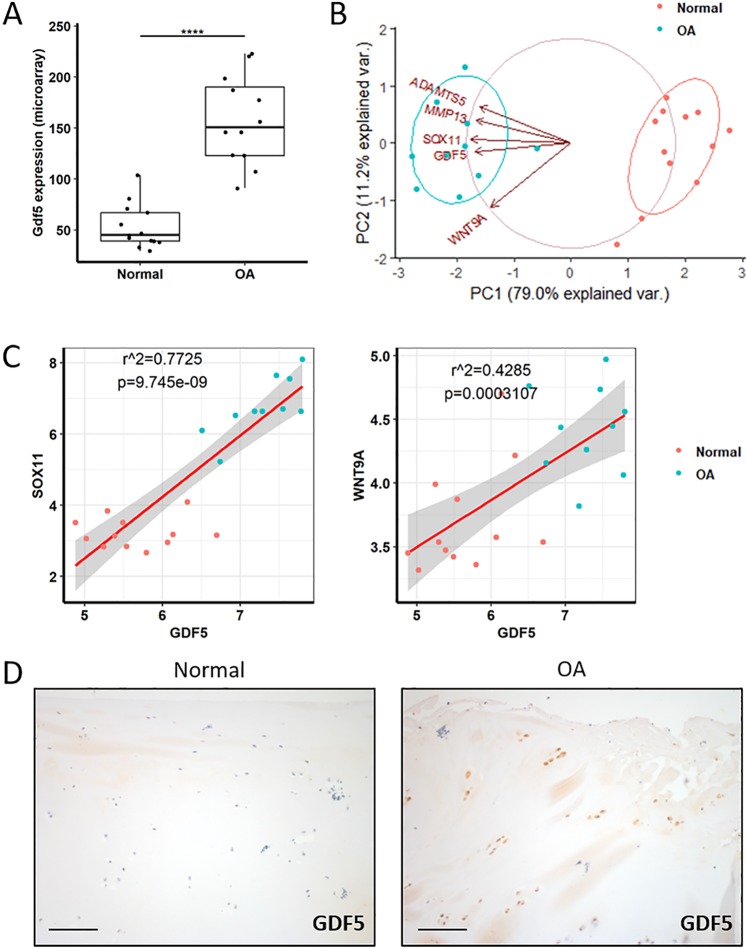
Figure 3.
Expression of GDF5 and upstream regulators in human OA cartilage. Gene expression data were obtained by mining a previously published microarray comparing normal versus OA human knee cartilage33. (A) Gdf5 expression was higher in OA cartilage compared to normal cartilage. Linear modelling (limma) with Benjamini-Hochberg correction for multiple comparisons. ****p < 0.0001. (B) Principal component analysis including the genes indicated showed complete separation of the normal samples from the OA samples. PCA was performed with the prcomp function in R. (C) Linear regression modelling showed GDF5 expression to strongly correlate with the expression of SOX11 (left) and WNT9a (right). (D) IHC staining for GDF5 in articular cartilage samples from patients with OA (n = 5 donors) in comparison to normal cartilage (n = 3 donors; 5 joints). Scale bars, 100 μm. See also Supplementary Fig. 3.

