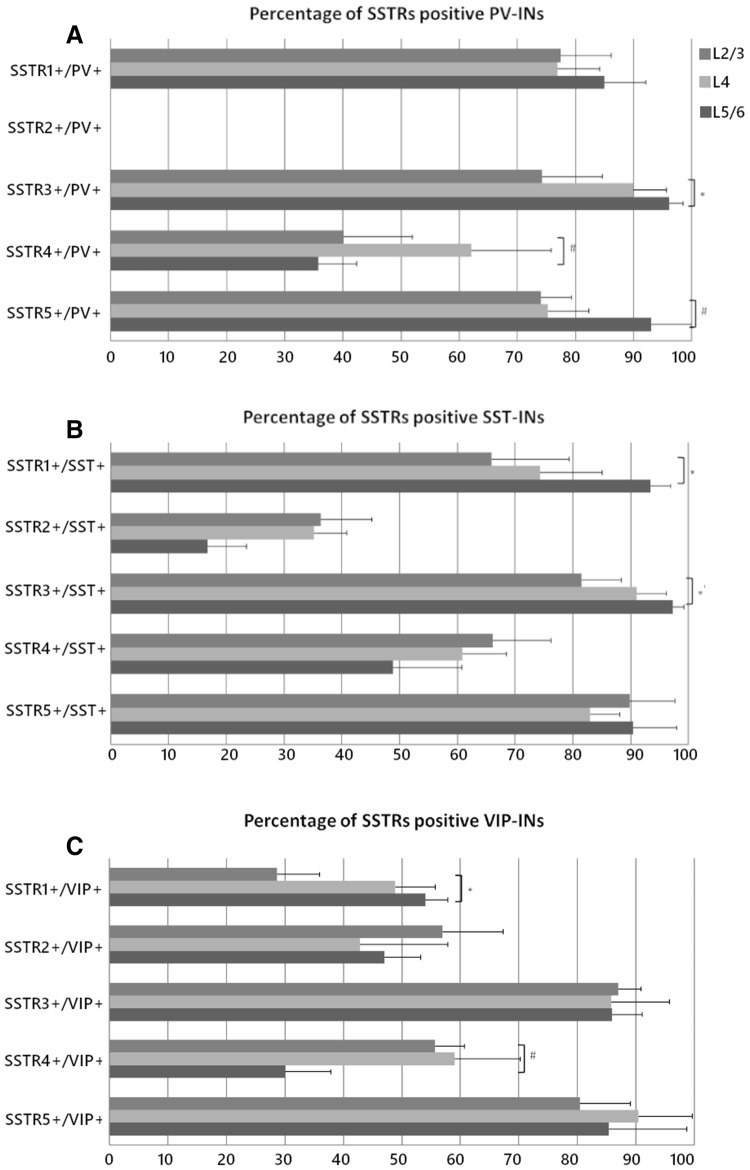
Fig. 7.
Quantitative assessment of co-localisation of SSTRs with PV, SST, and VIP containing INs in the particular cortical layers of the mouse somatosensory cortex. Graphs represent the percentage (mean + SD) of all labelled interneurons of each particular type that exhibited co-localisation with SSTRs in different cortical layers. Top panel: SSTR1-5 + PV INs, Middle panel: SSTR1-5 + SST INs, Bottom panel: SSTR1-5 + VIP INs. Kruskal–Wallis test, *p ≤ 0.05, #0.05 < p < 0.051; n = 3

