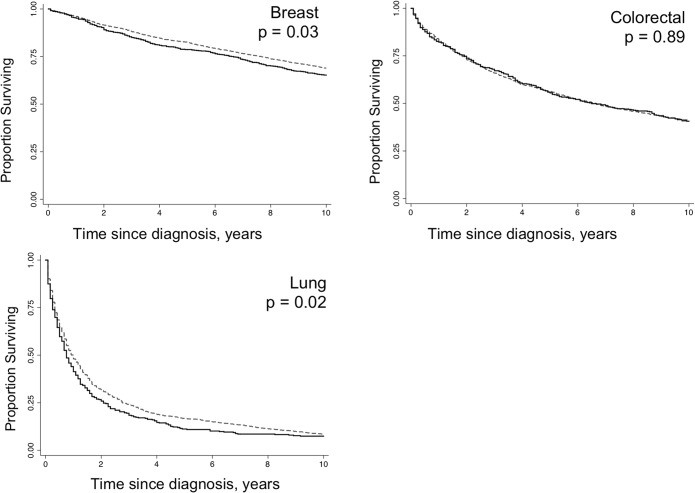
Figure 1.
Long-term cancer survival among individuals exposed to Hurricane Katrina. Solid lines represent individuals exposed to hurricane Katrina; dashed lines represent individuals not exposed to Hurricane Katrina. Matched on diagnosis, year of diagnosis, and socioeconomic status (measured as county-level median income).pvalues obtained from log rank test used to compare survival by exposure status.

