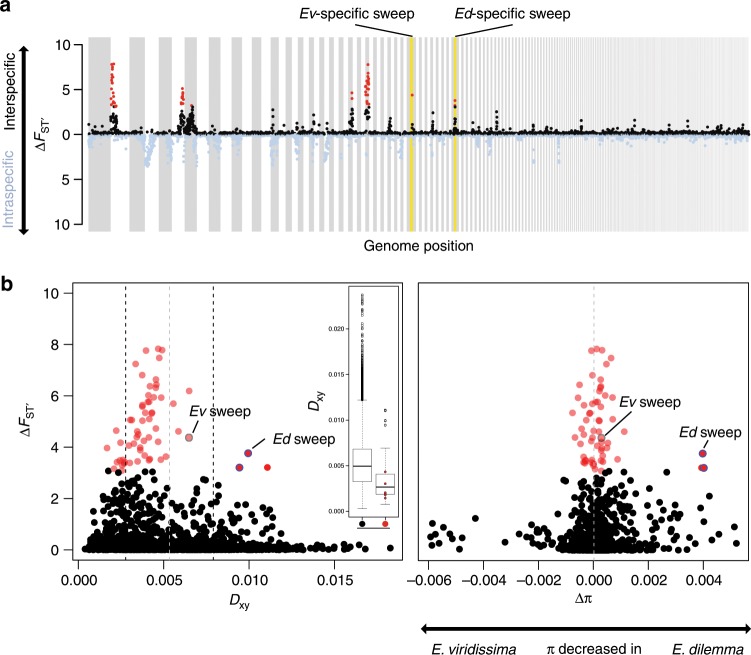
Fig. 2. Whole-genome differentiation.
a Eight regions of the genome revealed higher interspecific (black) than intraspecific (blue) differentiation (∆FST’ > 99th percentile red). Outlier peaks with E. dilemma (Ed) and E. viridissima (Ev)-specific selective sweep signatures are highlighted in yellow. b Interspecific divergence (Dxy) was negatively correlated with ∆FST‘ (left panel, r = −0.13, p = 0) and significantly reduced in outlier regions (red) in comparison with non-outliers (black, inlet, Mann–Whitney U-test, p = 0.001, mean Dxy of all seven outlier regions overlaid in red). Only two of the three ∆FST‘ outlier windows (circled blue) that revealed increased Dxy also had a net differential of intraspecific nucleotide diversity (∆π = πEv − πEd) skewed towards E. dilemma (right panel), a pattern expected in genomic regions evolving under positive selection. Both correspond to the same outlier peak (rightmost of those with yellow background in a). Gray dashed lines: mean Dxy and ∆π. Black dashed lines: 1 SEM Dxy. Boxplot elements: center line represents the median, box bounds represent the 25th and 75th percentile, and whiskers represent the 25th percentile − 1.5 * the interquartile range and the 75th percentile + 1.5 * the interquartile range.

