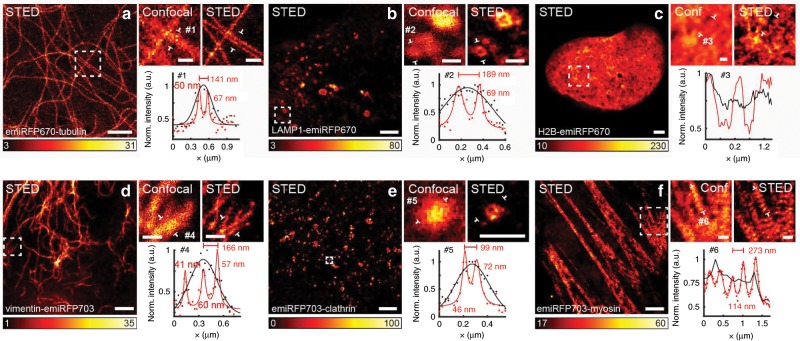
Fig. 4. Live-cell STED imaging of emiRFP670 and emiRFP703 fusions.
a Confocal and STED images of HeLa cells expressing emiRFP670-tubulin. #1 shows a line profile from the zoomed-in region of interest, and shows two tubules 141 nm apart, which cannot be distinguished in the confocal image. b Confocal and STED images of U2OS cells expressing LAMP1-emiRFP670. #2 shows a line profile across a lysosome with a diameter of 189 nm and a clearly resolved membrane in the STED data (red solid line). c Confocal and STED images of U2OS cells expressing H2B-emiRFP670. #3 is a line profile across a region of the nucleus, which shows several structures not resolvable in the confocal image. d Confocal and STED images of HeLa cells expressing vimentin-emiRFP703. #4 shows a line across three filaments in close proximity, which are not resolved in the confocal image. e Confocal and STED images of HeLa cells expressing emiRFP703-clathrin. #5 shows a line profile across a small clathrin-coated pit, only visible in the STED data. Line profile is 1 pixel wide. f Confocal and STED images of U2OS cells expressing emiRFP703-myosin. #6 shows a line profile across several myosin densities in close proximity, which look homogeneous in the confocal image of the same structure. Line profiles are taken from the raw images, and averaged over a width of 3 pixels unless otherwise stated. A Gaussian was used to fit the confocal data (black solid line) and a Lorentzian to fit the STED data (red solid line). Scale bars are 2 µm for the full images and 500 nm for the inserts showing the zoomed-in regions of interest.

