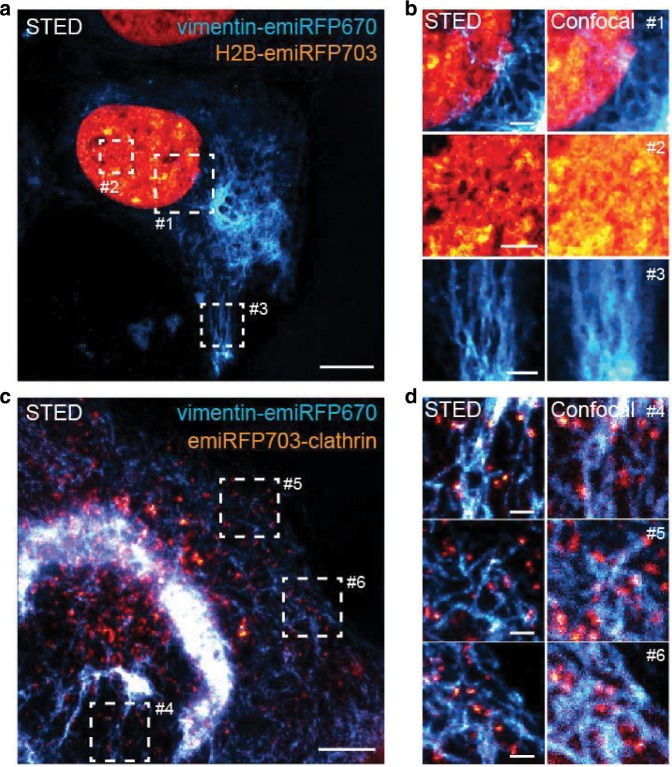
Fig. 6. Two-color STED imaging of emiRFP670 and miRFP703 fusions.
a STED image of a live U2OS cell expressing vimentin-emiRFP670 (cyan) and H2B-emiRFP703 (orange). Scale bar, 10 µm. b Three zoom-ins of the regions of interest #1–3 from image a. Scale bars, 2 µm. c STED image of a live U2OS cell expressing vimentin-emiRFP670 (cyan) and emiRFP703-clathrin (orange). Scale bar, 5 µm. d Three zoom-ins of the regions of interest #4–6 from image c. Scale bars, 1 µm.

