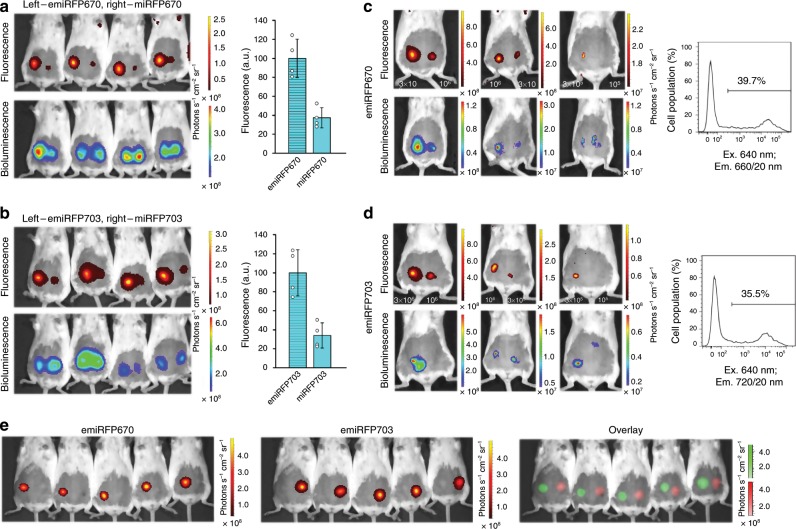
Fig. 7. Performance of emiRFPs in vivo.
a, b Comparison of emiRFP670 with parental miRFP670 (a) and emiRFP703 with parental miRFP703 (b). Fluorescence (top row) and bioluminescence (bottom row) images of living mice injected with 3 × 10⁶ COS-1 cells expressing emiRFP670 or emiRFP703 (left) and miRFP670 or miRFP703 (right). Cells were co-transfected with Rluc8. The filter sets were 640/20 nm excitation and 680/30 nm emission (a) or 675/20 nm excitation and 720/30 nm emission (b). Bar plots at the right show quantified mean fluorescence intensities (normalized to bioluminescence) that correspond to a and b. Error bars, double s.e.m. (n = 3 experiments). c, d Minimal number of detectable fluorescent cells. Fluorescence (top row) and bioluminescence (bottom row) images of living mice injected with various quantities of COS-1 cells expressing emiRFP670 (c) or emiRFP703 (d) and co-transfected with Rluc8. The filter sets were 640/20 nm excitation and 680/30 nm emission (c) or 675/20 nm excitation and 720/30 nm emission (d). Transfection efficiency of injected COS-1 cells obtained by FACS analysis shown on the right of each panel. e Two-color imaging of emiRFP670 and emiRFP703. Fluorescence images of living mice injected with 3 × 10⁶ COS-1 cells expressing emiRFP670 (left row) and emiRFP703 (middle row) and its unmixed overlay (bottom row) are shown. Images were acquired in 19 spectral channels using IVIS Spectrum instrument and spectrally unmixed.

