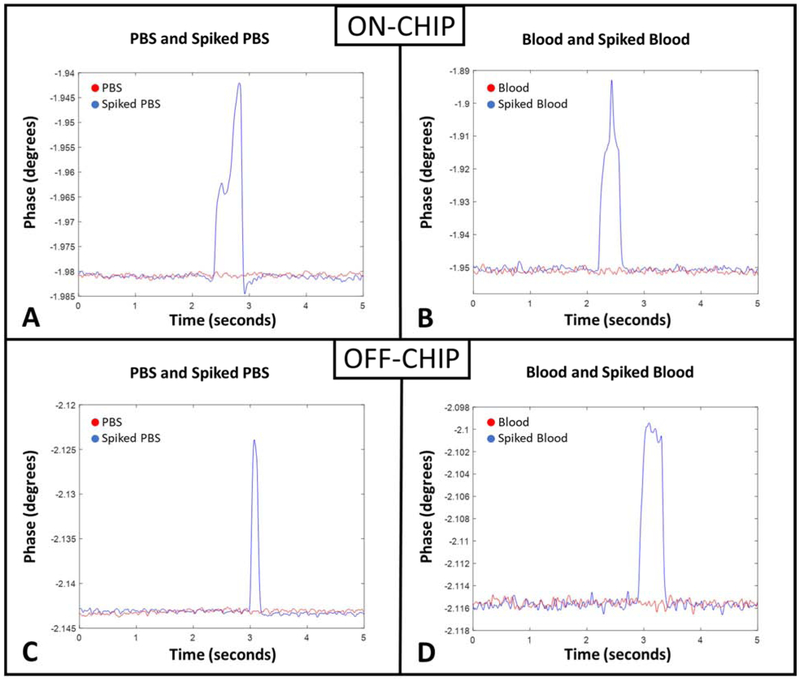
Figure 4.
Representation of impedance measured across the constriction channel. (A) ON-CHIP and (C) OFF-CHIP sample of impedance (Phase at frequency = 50 kHz) with only PBS (red) and PBS spiked with MDA-MB-231 (blue). (B) ON-CHIP and (D) OFF-CHIP sample (Phase at frequency = 50 kHz) with only murine blood (red) and murine blood spiked with MDA-MB-231 (blue).

