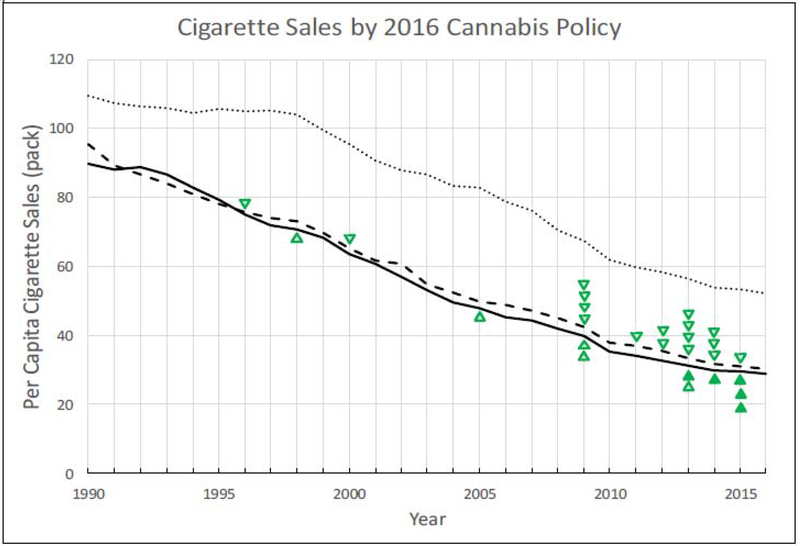
Figure 2 -.
Per capita state cigarette sales from 1990-2016. States are categorized into 3 groups based on cannabis policy in year 2016. Medical cannabis policy is categorized according to the primary specification based on work by Pacula et al (2015a) Dotted lines represent states where both medical and recreational cannabis remained illegal, dashed lines represent states with medical but not recreational legalization, and solid lines represent states that had both medical and recreational legalization as of 2016. Hollow triangles indicate states passing medical cannabis laws. Solid triangles represent states passing recreational cannabis laws. (Direction of triangles varies only to fit symbols in space between lines.)

