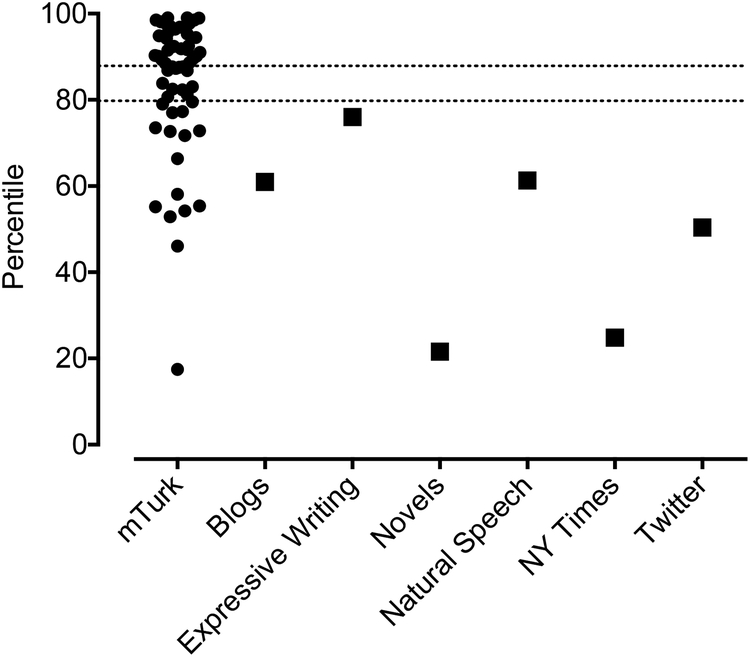
Figure 1. Authenticity Percentile for mTurk and Database Writing Sample Data.
Circles represent individual subject data for authenticity percentiles of writing narratives. Dotted lines are 95% confidence intervals surrounding the mTurk data means. Squares are point estimates for mean authenticity percentiles of writing samples from varied writing sources as documented in the LIWC 2015 handbook (Pennebaker et al. 2015).

