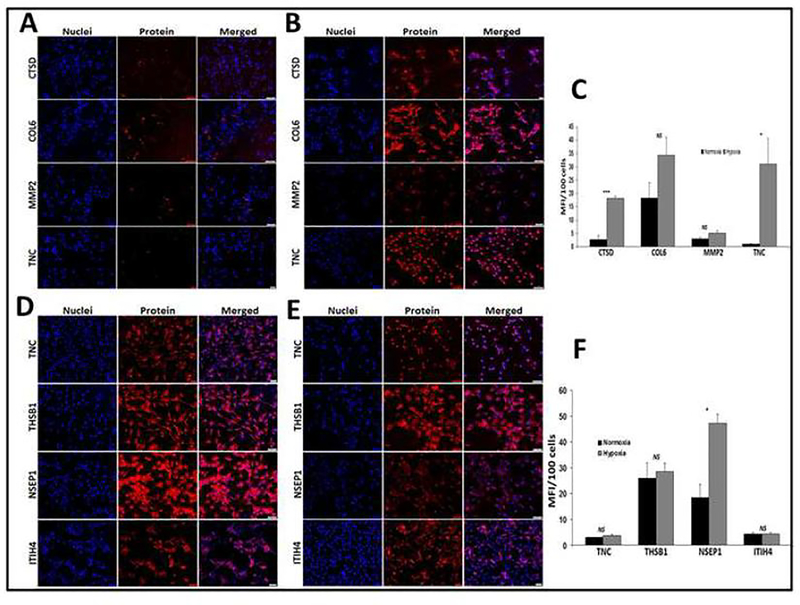
Fig. 4:
Immunofluorescence analysis for the expression of COL6A2, CTSD, TN-C and MMP2 by ADMSCs cultured under (A) hypoxia, (B) normoxia and (C) quantification of the expression proteins normalized to 100 cells and for the expression of THBS1, NSEP1, TN-C, and ITIH4 by tenocytes cultured under (D) hypoxia, (E) normoxia and (F) quantification of the expression proteins normalized to 100 cells: Images in the left columns show nuclear staining with DAPI; the images in the middle column show expression of proteins while the images in the right column show overlay of proteins with DAPI. Images were acquired at 20× magnification using CCD camera attached to the Olympus slide scanner. The graphs (C and F) represent MFI mean values with standard error. (NS – non-significant, * P<0.05, and *** P<0.001).

